• Journal of Geographical Sciences
  • Vol. 30, Issue 10, 1664 (2020)
Haolong LIU1、2, Junhu DAI1、2, Junhui YAN3, Fanneng HE1、2, Quansheng GE1、2、*, and Chongxing MU4
Author Affiliations
  • 1Key Laboratory of Land Surface Pattern and Simulation, Institute of Geographic Sciences and Natural Resources Research, CAS, Beijing 100101, China
  • 2University of Chinese Academy of Sciences, Beijing 100101, China
  • 3The College of Urban and Environmental Sciences, Xinyang Normal University, Xinyang 464000, Henan, China
  • 4The Taizhou Meteorological Bureau, Taizhou 318000, Zhejiang, China
  • show less
    DOI: 10.1007/s11442-020-1806-8 Cite this Article
    Haolong LIU, Junhu DAI, Junhui YAN, Fanneng HE, Quansheng GE, Chongxing MU. Temperature variations evidenced by records on the latest spring snowing dates in Hangzhou of eastern China during 1131-1270AD[J]. Journal of Geographical Sciences, 2020, 30(10): 1664 Copy Citation Text show less
    The statistical relationships between the LSSD and February-April mean temperature in Hangzhou during 1951-2010 ( ·: Annual samples; —: Linear fit line; DOY: Day of the year, also called Ordinal date (e.g., 2 represents January 2))
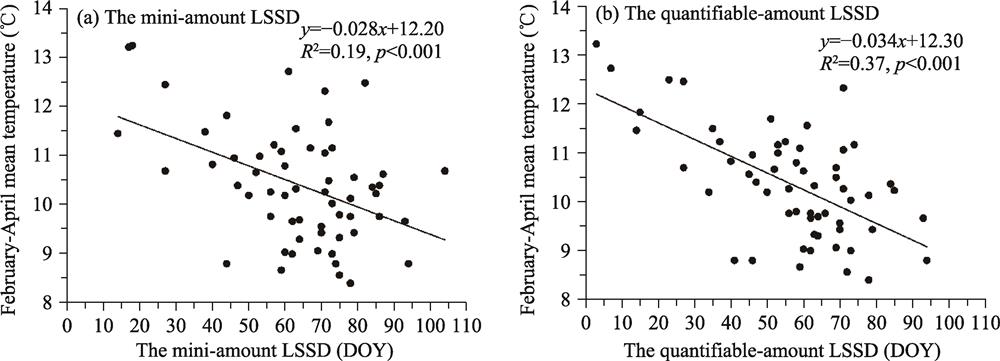
    Fig. 1. The statistical relationships between the LSSD and February-April mean temperature in Hangzhou during 1951-2010 ( ·: Annual samples; —: Linear fit line; DOY: Day of the year, also called Ordinal date (e.g., 2 represents January 2))
    The climatic significances of Hangzhou’s quantifiable-amount LSSD during different time spans
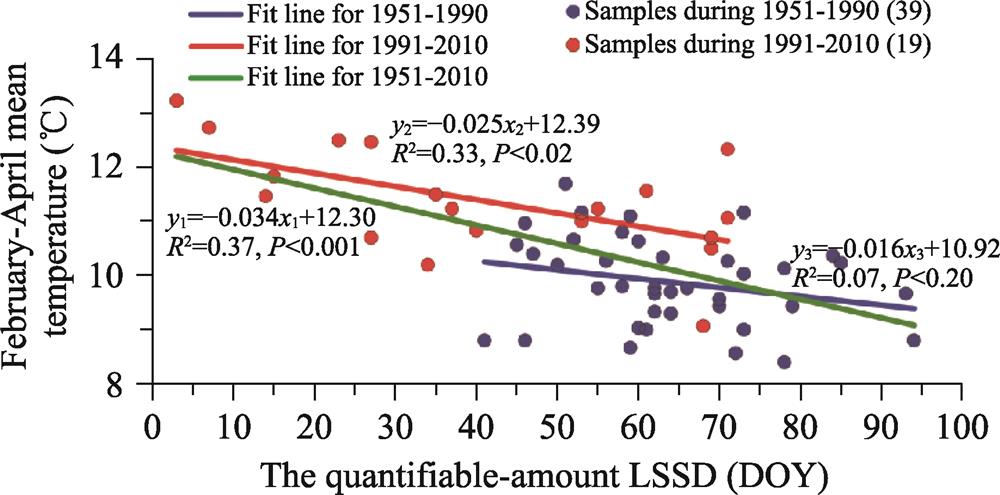
    Fig. 2. The climatic significances of Hangzhou’s quantifiable-amount LSSD during different time spans
    The relationships between the 10-year mean LSSD and 6 statistic indexes in Hangzhou. The dots are samples; the red solid lines are nonlinear trend lines fitted by the Boltzmann function; the blue dotted lines are prediction bands at the 95% confidence level; the green beelines refer to the six corresponding statistic values for the LSSDs in the decade when the 10-year mean LSSD is March 6.
    Fig. 3. The relationships between the 10-year mean LSSD and 6 statistic indexes in Hangzhou. The dots are samples; the red solid lines are nonlinear trend lines fitted by the Boltzmann function; the blue dotted lines are prediction bands at the 95% confidence level; the green beelines refer to the six corresponding statistic values for the LSSDs in the decade when the 10-year mean LSSD is March 6.
    Comparison of reconstructed climatic series for 1131-1270. (a) The inter-annual variations in the LSSD in Hangzhou and its abrupt change detection result of probability anomaly, ´ refer to 57 samples later than the perennial mean of the LSSDs, black line refers to the curve of probability distribution, and Southern Song Dynasty is taken as the reference period; (b) Reconstructed series of the LSSDs in Hangzhou with different temporal resolutions, the red step line refers to a 10-year temporal resolution, the sand-yellow step line refers to a 30-year temporal resolution, and the black Zero Anomaly line is the mean LSSD (March 6) during the reference period 1951-1980. (c) Decadal-scale variations in temperature at two other regions in 1131-1270, the orange line refers to the result revealed by historical documents in Central China (et al., 2007" target="_self" style="display: inline;">Wang et al., 2007), the green line refers to the result revealed by tree rings in Animaqin Mountains (et al., 2016" target="_self" style="display: inline;">Chen et al., 2016), the black Zero Anomaly line refers to the corresponding means in different reference periods (the past millennia for the former, and the past two millennia for the latter), the blue area indicates relatively cold periods, and the red area relatively warm periods. (d) Variations in the PDO index (Macdonald and Case, 2005) in 1131-1270, the yellow line refers to annual values, and the rose line refers to 11-point running averages.
    Fig. 4. Comparison of reconstructed climatic series for 1131-1270. (a) The inter-annual variations in the LSSD in Hangzhou and its abrupt change detection result of probability anomaly, ´ refer to 57 samples later than the perennial mean of the LSSDs, black line refers to the curve of probability distribution, and Southern Song Dynasty is taken as the reference period; (b) Reconstructed series of the LSSDs in Hangzhou with different temporal resolutions, the red step line refers to a 10-year temporal resolution, the sand-yellow step line refers to a 30-year temporal resolution, and the black Zero Anomaly line is the mean LSSD (March 6) during the reference period 1951-1980. (c) Decadal-scale variations in temperature at two other regions in 1131-1270, the orange line refers to the result revealed by historical documents in Central China (Wang et al., 2007), the green line refers to the result revealed by tree rings in Animaqin Mountains (Chen et al., 2016), the black Zero Anomaly line refers to the corresponding means in different reference periods (the past millennia for the former, and the past two millennia for the latter), the blue area indicates relatively cold periods, and the red area relatively warm periods. (d) Variations in the PDO index (Macdonald and Case, 2005) in 1131-1270, the yellow line refers to annual values, and the rose line refers to 11-point running averages.
    YearJC date*GC date**Record sources
    12244-64-13Records of Wuxing Zhi in the History of Song Dynasty
    12255-95-16Records of Wuxing Zhi in the History of Song Dynasty
    12264-265-3Poem entitled “A journey on a thundering day in winter” by Hong Kuizhi
    12313-173-23Records of Wuxing Zhi in the History of Song Dynasty
    12334-184-25Records of Wuxing Zhi in the History of Song Dynasty
    12343-53-12Records of Wuxing Zhi in the History of Song Dynasty
    12353-223-29Records of Wuxing Zhi in the History of Song Dynasty
    12383-63-13Records of Wuxing Zhi in the History of Song Dynasty
    12433-13-8Volume 33 from the Complete Literature of the History of Song Dynasty
    12443-113-18***Poem entitled “Snowing in later spring in 1244” by Zhu Nanjie
    12463-13-8Records of Wuxing Zhi in the History of Song Dynasty
    12503-53-12Volume 33 from the Complete Literature of the History of Song Dynasty
    12533-43-11Records of Wuxing Zhi in the History of Song Dynasty
    12544-44-11Records of Wuxing Zhi in the History of Song Dynasty
    12583-73-14****The Abnormal Phenomena part from the Song Huiyao Jigao
    12593-13-8Records of Wuxing Zhi in the History of Song Dynasty
    12643-53-12Records of Wuxing Zhi in the History of Song Dynasty
    Table 1.

    (Continued)

    YearJC date*GC date**Record sources
    11313-304-6Records of Wuxing Zhi in the History of Song Dynasty11
    11333-43-11Volume 62 from the Major Events Records from 1127 to 1162
    11353-203-27Biography of “Gao Zong” from the History of Song Dynasty
    11363-93-16Records of Wuxing Zhi in the History of Song Dynasty
    11373-143-21Records of Wuxing Zhi in the History of Song Dynasty
    11434-124-19Records of Wuxing Zhi in the History of Song Dynasty
    11473-53-12Records of Wuxing Zhi in the History of Song Dynasty
    11483-63-13Records of Wuxing Zhi in the History of Song Dynasty
    11553-23-9Volume 168 from the Major Events Records from 1127 to 1162
    11584-64-13Records of Wuxing Zhi in the History of Song Dynasty
    11593-43-11Records of Wuxing Zhi in the History of Song Dynasty
    11603-153-22Volume 183 from the Major Events Records from 1127 to 1162
    11623-123-19Volume 197 from the Major Events Records from 1127 to 1162
    11633-33-10The Abnormal Phenomena part from the Song Huiyao Jigao
    11643-163-23The Abnormal Phenomena part from the Song Huiyao Jigao
    11653-304-6The Abnormal Phenomena part from the Song Huiyao Jigao
    11663-254-1Records of Wuxing Zhi in the History of Song Dynasty
    11673-63-13Records of Wuxing Zhi in the History of Song Dynasty
    11684-24-9Volume 25 from the Complete Literature of the Song History
    11693-13-8Records of Wuxing Zhi in the History of Song Dynasty
    11713-193-26Records of Wuxing Zhi in the History of Song Dynasty
    11733-23-9The Shihuo Zhi part from the Song Huiyao Jigao
    11863-83-15Records of Wuxing Zhi in the History of Song Dynasty
    11883-203-27Records of Wuxing Zhi in the History of Song Dynasty
    11893-13-8The Abnormal Phenomena part from the Song Huiyao Jigao
    11903-193-26Records of Wuxing Zhi in the History of Song Dynasty
    11913-103-17The Abnormal Phenomena part from the Song Huiyao Jigao
    11933-264-2The Abnormal Phenomena part from the Song Huiyao Jigao
    11973-143-21Records of Wuxing Zhi in the History of Song Dynasty
    11993-63-13Records of Wuxing Zhi in the History of Song Dynasty
    12003-153-22Records of Wuxing Zhi in the History of Song Dynasty
    12043-13-8Records of Wuxing Zhi in the History of Song Dynasty
    12053-193-26Volume 29 from the Complete Literature of the Song History
    12073-23-9Records of Wuxing Zhi in the History of Song Dynasty
    12083-23-9Records of Wuxing Zhi in the History of Song Dynasty
    12113-93-16Records of Wuxing Zhi in the History of Song Dynasty
    12133-93-16Records of Wuxing Zhi in the History of Song Dynasty
    12163-23-9Records of Wuxing Zhi in the History of Song Dynasty
    12173-233-30Records of Wuxing Zhi in the History of Song Dynasty
    12234-124-19The Abnormal Phenomena part from the Song Huiyao Jigao
    Table 1.

    Records of the LSSDs in Hangzhou during Southern Song Dynasty

    Independent variableResidual sum of squaresAdjusted R2
    Linear fittingQuadratic fittingBoltzmann fittingLinear fittingQuadratic fittingBoltzmann fitting
    The latest of decadal LSSDs413.99371.33357.660.770.790.79
    The intra-decadal averages of the top 2 LSSD sorted in the order of latest to earliest428.61211.31197.170.770.880.88
    The intra-decadal averages of the top 3 LSSD sorted in the order of latest to earliest252.3594.2286.430.860.950.95
    The intra-decadal averages of the top 4 LSSD sorted in the order of latest to earliest204.7667.2161.620.890.960.96
    The intra-decadal averages of the top 5 LSSD sorted in the order of latest to earliest105.5946.8344.980.940.970.97
    The intra-decadal averages of the top 8 LSSD sorted in the order of latest to earliest15.9815.5514.800.990.990.99
    Table 2.

    Different fitting results of three functions on the 10-year mean LSSD in Hangzhou

    Haolong LIU, Junhu DAI, Junhui YAN, Fanneng HE, Quansheng GE, Chongxing MU. Temperature variations evidenced by records on the latest spring snowing dates in Hangzhou of eastern China during 1131-1270AD[J]. Journal of Geographical Sciences, 2020, 30(10): 1664
    Download Citation