Haolong LIU, Junhu DAI, Junhui YAN, Fanneng HE, Quansheng GE, Chongxing MU. Temperature variations evidenced by records on the latest spring snowing dates in Hangzhou of eastern China during 1131-1270AD[J]. Journal of Geographical Sciences, 2020, 30(10): 1664
Copy Citation Text
We collected and verified documentary records of the latest spring snowing dates (LSSD) in Hangzhou during Southern Song Dynasty. Furtherly, the statistical correlation between this proxy and February-April mean temperature in Hangzhou was examined, and samples later than the perennial mean of the LSSD during Southern Song Dynasty were transformed into the decadal mean of LSSD by means of Boltzmann function. General characteristics of this reconstructed LSSD series with a 10-year temporal resolution was analyzed, and it was also compared with other documentary evidences and reconstructed climate series in China for the period 1131-1270. The results and discussion suggested that: (1) Records of the LSSD in Hangzhou during Southern Song Dynasty did not refer to ice pellets and graupels, which had an explicit climate significance (-0.34oC/10d, R2=0.37, p<0.001). However, when this proxy is used to reconstruct temperature changes, all dates should be converted into proleptic Gregorian style and meet the same criterion of “true Qi” as the Chinese traditional calendar after 1929. (2) The decadal mean of LSSD can be effectively estimated by using the forefront of LSSD in the decade on the basis of Boltzmann function, whose extrapolation has a lesser uncertainty than those on the basis of linear models or polynomial models. (3) The spring climate in Hangzhou during 1131-1270 was almost as warm as the period 1951-1980. At the centennial scale, this period can be divided into two phases: the cold 1131-1170 and the warm 1171-1270. In the latter, 1181-1200 and 1221-1240 were two cold intervals at the multi-decadal scale. (4) The reconstructed LSSD series was consistent well with other documentary evidences and reconstructed climate series in China for 1131-1270, which may reflect the influence on the climate over most regions of China imposed by the Pacific Decadal Oscillation (PDO).
The Medieval Warm Period (MWP) is a key study period of the Past Global Changes (PAGES) project (PAGES, 2009). Revealing the climatic rhythms of this period has important scientific significance in understanding of multi-scale climate variabilities and its impacts, diagnosing the historical significance of global warming in the 20th century, and projecting future climate change scenarios. Presently, many achievements on this field have been made by use of different paleoclimate archives scattered over the world. However, several key issues (e.g., the starting and ending time of MWP, as well as its stage evolution and climatic amplitudes) are still controversial (Hughes and Diaz, 1994; NRC, 2006; Diaz et al., 2011). Therefore, more high-resolution proxy data at regional scale is needed to narrow the related uncertain ranges.
China has carried out extensive research on medieval warming and made significant progress over the past decade (Ge et al., 2014). In the western region and the transitional zone between the western and the eastern, numerous proxy series at a sub-annual to decadal resolution were reconstructed by utilizing natural evidences, such as ice cores, lacustrine laminated sediments, and tree rings (e.g. Yao et al., 2007; Liu et al., 2014; Zhang et al., 2014; Chen et al., 2016; Xu et al., 2019). Consequently, the regional characteristics of temperature changes in China during the MWP were well interpreted. By contrast, in the eastern region, which is known for its rich historical documents, that period solely has two reconstructed temperature series with 10-year and 30-year resolutions (Ge et al., 2003; Wang et al., 2007). Moreover, the analyses of the characteristics of temperature changes during Southern Song Dynasty (1127-1279) differ among researchers. The main ideas have been that: 1) the climate in central-east China was generally cooler than at present, and 1200 or thereabouts was the turning point from coldness to warmness (Chu, 1925a; Chu, 1925b; Chu, 1972); 2) the climate in central-east China remained cold, with no significant turning point (Zhang, 2009); 3) the climate in central-east China was at least as warm as the present, undergoing the transition from coldness to warmness at approximately the year 1200 (or 1192) and no significant cooling fluctuation occurred after the warming (Ge et al., 2003; Liu, 1982; Zhang, 1993; Man, 1993; Man, 2009); and 4) the climate in central China was generally warmer than at present, and the warming had occurred since 1140, with two cooling periods during the 1160s and 1221-1250 (Wang et al., 2007).
These differences in opinion on temperature changes during Southern Song Dynasty may derive from different temporal resolutions, as well as different proxy records and data-processing methods (Wang and Yang, 2018). For example, Chu considered the documentary records of the latest spring snowing dates (LSSD) in Hangzhou as the main evidence for inferring the climate during Southern Song Dynasty (Chu, 1925a; Chu, 1925b; Chu, 1972). However, his opinion triggered the two following debates in China: 1) whether it is necessary to make a manual revision of the Julian calendar dates before October 15, 1582 (Chu, 1925; Zhang, 1993; Man, 2009; Zhang, 2009), which are converted from the Chinese lunisolar calendar, when comparing the differences between the ancient and modern phenological phenomena; and 2) whether the LSSD in Hangzhou has an explicit climate significance (Zhang, 1993; Man, 2004; Zhao, 2004). In addition, data-analysis methods for the LSSDs are quite different. Some scholars only treated them as a type of cold events and used the cold-warm frequency method (Zhang, 2009) or the cold index method (Wang et al., 2007) to reconstruct the climatic proxy series. Others used the indirect inference method that divided the records into groups of a 10-year interval and the latest values of each group were averaged together, then, the average was compared with the same index at present (Chu, 1925; Zhang, 1993).
Based on the recent collection and revision of the LSSDs in Hangzhou, the present study analysed the climate significance of such records and then reconstructed a new temperature proxy series for Southern Song Dynasty with a 10-year resolution, using a method different from those applied in previous studies. The result can help deepen the knowledge of the decadal temperature change in eastern China during 1131-1270.
2 Data and its pre-processing
2.1 Study area and record sources
Hangzhou (120.2°E, 30.3°N) is located at the southern tip of the Yangtze River Delta and the western edge of Hangzhou Bay, where it has a humid subtropical monsoon climate. As the capital of Southern Song Dynasty, it, called Lin’an at that time, had a prosperous economy, a rich culture, and abundant documentary records, thereby providing a convenient setting for the study of the Southern Song history. Among various historical documents, the Song Huiyao Jigao and the History of Song have the most records of spring snows during that period. In 1925, Chu first compiled a 31-year record of spring snows in Hangzhou during Southern Song Dynasty (Chu, 1925). Later on, the record was extended to 46 years (Chu, 1972) and 52 years (Man, 1990). Our study further extended the relevant record to 62 years, by giving an important supplement mainly from the Complete Literature of the History of the Song Dynasty, as well as some collections of the poems of this period.
2.2 The data filtering of historical records
The documentary records of spring snows in Southern Song Dynasty can be divided into two types. One reflected that snowfalls were heavy and the other indicated that LSSDs were later than normal. However, previous studies didn't make a clear distinction between them. Some researchers mistook the former for the latter, thereby affecting the reliability of reconstruction results. On this account, we suggest that the former records should be abandoned in the procedure of data pre-processing. Furthermore, the standard for spring snow’s being later than normal should be quantifiable. Thus, we analysed the relevant LSSDs in Hangzhou which were definitely noted to be later than normal in Southern Song Dynasty, and found that the earliest date was at least one day later than the date of Jingzhe (solar term). This finding is consistent with what the famous scholar Yuan Fu had said in a memorial presented to the Emperor Zhao Kuo in Southern Song Dynasty. Consequently, the snow date’s being later than the solar term Jingzhe can be viewed as a standard for abnormal snow. According to this standard, records of LSSD in Hangzhou during Southern Song Dynasty were 57 years.
2.3 Chinese-Western calendar conversion
It is an international practice to convert the Julian calendar to the proleptic Gregorian calendar, when comparing phenology differences between ancient and modern times (Pfister et al., 1999; Camuffo et al., 2010; Možný et al., 2012). Nevertheless, some paleoclimate researchers in China didn’t follow it. The superficial reason was that calendar books they utilized (Xue, 1956; Fang and Fang, 1987) for the Chinese-Western calendar conversion made no mention of the conversion between the Julian and proleptic Gregorian calendars. However, the nub of the matter is that they equated the date expression with the date calculation, which the astrohistorian Jiang Xiaoyuan had remarked in an article (Jiang, 2007). In addition, other scholars did convert dates of Chinese documentary records from the Julian calendar to the proleptic Gregorian calendar (Chu, 1925; Man, 2009). But they did not elaborate on their technical processes, and their results were partially wrong. Therefore, it is very necessary to interpret the related background factors and the procedure.
The necessary background knowledge for calendar conversion includes not only the Western calendar reform (adoption of the Gregorian calendar) in 1582, but also the Chinese calendar reform (adoption of the Shixian Li calendar) in 1645. The former corrected the increasingly inaccuracy with respect to the seasons in the old Julian calendar, thereby generating several days’ difference between Old Style and New Style dates for the same event. The latter replaced Mean Solar Term with True Solar Term, thereby improving the time accuracy of Chinese solar terms. It is often one-day or two-day difference between a true solar term and its cognominal mean solar term (Qu, 2008). For the above reasons, phenology differences between ancient and modern times should be compared under the same styles of calendar system and solar term.
The present study suggests the following calendar conversion steps for Chinese historical records prior to 1582: first, Chinese calendrical dates should be converted to Julian calendrical dates; then, the ancient and modern dates of the true solar term, which is the nearest to the to-be-converted date, should be checked out; finally, the Julian dates of these records can be revised into the proleptic Gregorian dates, according to the days difference in true solar term between proleptic and modern Gregorian calendars. Besides, the Chinese calendrical dates can also be converted to the proleptic Gregorian dates directly by using the Julian-Gregorian-Dee date calculator. The present study reported the proleptic Gregorian dates of the LSSDs in Hangzhou during Southern Song Dynasty (Table 1).
Year
JC date*
GC date**
Record sources
1224
4-6
4-13
Records of Wuxing Zhi in the History of Song Dynasty
1225
5-9
5-16
Records of Wuxing Zhi in the History of Song Dynasty
1226
4-26
5-3
Poem entitled “A journey on a thundering day in winter” by Hong Kuizhi
1231
3-17
3-23
Records of Wuxing Zhi in the History of Song Dynasty
1233
4-18
4-25
Records of Wuxing Zhi in the History of Song Dynasty
1234
3-5
3-12
Records of Wuxing Zhi in the History of Song Dynasty
1235
3-22
3-29
Records of Wuxing Zhi in the History of Song Dynasty
1238
3-6
3-13
Records of Wuxing Zhi in the History of Song Dynasty
1243
3-1
3-8
Volume 33 from the Complete Literature of the History of Song Dynasty
1244
3-11
3-18***
Poem entitled “Snowing in later spring in 1244” by Zhu Nanjie
1246
3-1
3-8
Records of Wuxing Zhi in the History of Song Dynasty
1250
3-5
3-12
Volume 33 from the Complete Literature of the History of Song Dynasty
1253
3-4
3-11
Records of Wuxing Zhi in the History of Song Dynasty
1254
4-4
4-11
Records of Wuxing Zhi in the History of Song Dynasty
1258
3-7
3-14****
The Abnormal Phenomena part from the Song Huiyao Jigao
1259
3-1
3-8
Records of Wuxing Zhi in the History of Song Dynasty
1264
3-5
3-12
Records of Wuxing Zhi in the History of Song Dynasty
3.1 Approach to the climate significance of Hangzhou’s LSSD
The large-scale equatorward flow of cold arctic air due to the strong Asian polar vortex and the weak Western Pacific Subtropical High (WPSH) is the atmospheric-circulation background for the spring chilling damage in the south to the 30°N of China (Liu and Gao, 2001). Under the condition of adequate moisture in Hangzhou Bay, the Hangzhou’s late spring snow is indeed a sign of storms travelling southward (Chu, 1925). However, previous studies (Zhang, 1993; Man, 2004) indicated that there was no significant statistical relationship between the LSSD and the spring mean temperature in Hangzhou. Therefore, the recorded date of late spring snows was not considered as a reliable proxy indicator for historical temperature. Here, we suggest that before quantifying the climate significance of the LSSD, it is necessary to validate whether the ancient and modern standards of the LSSD are consistent.
The Annual Report of China’s Land Surface Meteorology (1971-2010) defines the LSSD as follows: each year prior to June 30, the latest date of solid precipitation (except hail), regardless of the amount. According to this standard, mini-amounts of snow (graupel, rice snow or ice pellets) are likely to occur on this specific day. However, in Southern Song Dynasty, for the purpose of disaster assessment and relief coordination, the departments of agriculture and archives were required to report and document the annual lack or excess of rain and snow in every province. Thus, due to their very little harm to crops, mini-amount snows were generally ignored by the related officials. In addition, as described in the Records of Wuxing Zhi in the History of Song Dynasty, graupel and snow were distinguishable at that time, and most records referred to quantifiable sleet, snow and heavy snow. Therefore, the present study argues that the modern standard of LSSD should not be applied mechanically to the analysis of the ancient LSSDs.
To compare the difference in the climate significance between the ancient and modern LSSDS, we first extracted the annual February-April mean temperature during 1951-2010 from the “Dataset of Monthly Values of Climate Data from Chinese Surface Stations” in the China Meteorological Data Service Center (CMDC). Then, according to the ancient and modern standards, we compiled two LSSD series during 1951-2010 which were based on the Annual Report of China’s Land Surface Meteorology (1971-2010), Monthly Report of China’s Land Surface Meteorology (1971-2010), China’s Daily Precipitation during 1951-1970 (CWB, 1975) and China’s Daily Meteorology: 1961-1970 (CWB, 1978). Among those LSSDs, the missing records in 1997 and 1998 were completed with the historical weather dataset of Hangzhou, which was shared on the website of Weather Underground (https://www.wunderground.com). Finally, using a linear regression equation, we separately calculated the two correlations between the series of LSSD and the February-April mean temperature in Hangzhou.
3.2 Reconstruction of the LSSD series
The extant records of Southern Song Dynasty’s LSSD are not continuous on a yearly basis. Based on the convention of recording the anomaly but not usually recording the normal in Chinese historical works, those extant records can be considered as anomaly samples implying cold springs at that time. Thus, it is difficult to reconstruct the interannual to decadal variations of the LSSD during 1131-1270 via collecting every year’s data. However, we assume that those anomaly samples were at the forefront of decadal LSSDs, and the corresponding statistics drawn from different sample sizes in each decade may be statistically associated with the decadal mean LSSD, such that it is possible to reconstruct decadal mean LSSD by use of those anomaly records.
Thus, we reconstructed the series of decadal mean LSSD during 1131-1270 according to the following steps: 1) Basing on the LSSDs in Hangzhou during 1951-2010, which adopted the standard of excluding mini-amount snows, we first constructed the series of the 10-year running mean of the modern LSSDs. 2) Corresponding with different LSSD records (i.e., 1, 2, 3, 4, 5, and 8) during each decade of Southern Song Dynasty, six time series of LSSD anomaly (i.e., the latest date, the averages of the top 2 latest dates, the top 3 latest dates, the top 4 latest dates, the top 5 latest dates and the top 8 latest dates in the decade) were also derived from Hangzhou’s modern LSSDs using the running method. 3) We took the time series of the 10-year running mean of the modern LSSDs in Hangzhou as the dependent variable y and each of the above six other sequences as the independent variable x to construct different regression models (i.e., the linear regression, quadratic regression and Boltzmann regression); then, the best model was picked out according to the results of goodness-of-fit test. Among those, the Boltzmann regression was expressed as the equation 1. 4) Different statistics of LSSD anomaly corresponding to each decadal records during 1131-1270 were inputted into the fit model as the values of independent variable x, and the values of dependent variable y were calculated.
where y and x are the variables. A1, A2, x0, and dx are four parameters fitted through the least-squares estimation.
3.3 Analysis of the reconstructed LSSD series
Three important characteristic statistics of the reconstructed series are considered in the present study: the mean, the periodic change, and the amplitude. Among those, the judgement on the periodic change was made through the integrated analysis of abrupt change and decadal variations of the LSSD samples. To detect the abrupt-change points of LSSD samples, we measured relative frequency deviations of this anomalous climatic event. The detection method has been successfully applied in many case studies of historical climate (e.g., Zhang et al., 1996; Fei et al., 2001). The equation of relative frequency deviation can be written as follows:
where M is the frequency of the anomalous LSSD (later than normal) occurred in Hangzhou during the whole time span T (i.e., 140 years) for 1131-1270, mk is the relative frequency of this climatic event occurred during the sub-time-span tk (varied from 0 to 140), and θ is the piecewise linear function for k. According to the previous studies (Zhang et al., 1996; Fei et al., 2001), the years corresponding to the maximum and minimum of θ can be considered as the abrupt-change points of climate.
4 Results
4.1 The climate significance of LSSD in Hangzhou
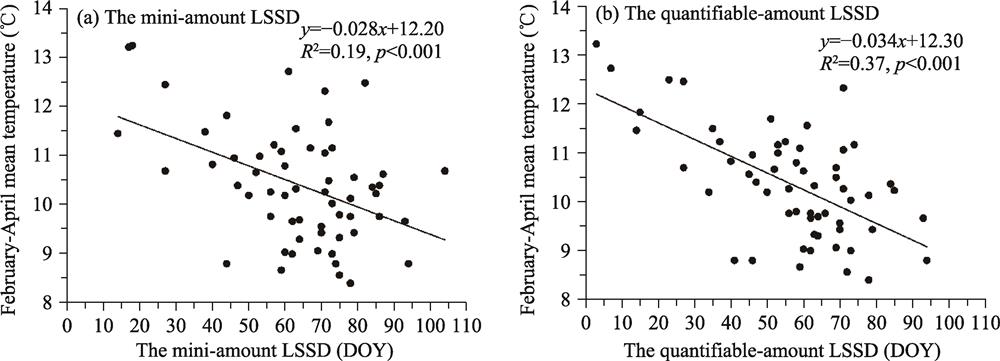
As shown in Figure 1, regardless of the snowfall standard, the LSSD in Hangzhou during 1951-2010 is significantly correlated with the local February-April mean temperature. However, the quantifiable-amount LSSD has a better climate significance than the mini-amount LSSD. The detailed results are as follows: 1) the correlation coefficient and the slope between the quantifiable-amount LSSD and the local spring mean temperature are -0.61 and -0.34℃/10 d, respectively (number of observations n = 58, p<0.001). 2) The correlation coefficient and the slope between the mini-amount LSSD and the spring mean temperature is -0.45 and -0.28℃/10 d, respectively (n = 60, p<0.001).
Figure 1.
The statistical relationships between the LSSD and February-April mean temperature in Hangzhou during 1951-2010 ( ·: Annual samples; —: Linear fit line; DOY: Day of the year, also called Ordinal date (e.g., 2 represents January 2))
Why did previous studies suggest that there was no significant correlation between the above two variables? When adopting the same time span (i.e., 1951-1990) as previous studies, our data also leads to similar conclusions: the correlation coefficient between the quantifiable-amount LSSD and the spring mean temperature is -0.26 (p<0.20); similarly, the coefficient between the mini-amount LSSD and the spring mean temperature is -0.11 (p<0.50). According to Figure 2, the variation in LSSD’s climatic significance can be due to the difference in sample’s size and distribution pattern during the corresponding time span.
Figure 2.
The climatic significances of Hangzhou’s quantifiable-amount LSSD during different time spans
4.2 The conversion of intra-decadal LSSDs to decadal mean LSSD
The data-fitting results show that all the above six indicators (the latest one in decadal LSSDs and the averages of the top 2, 3, 4, 5 and 8 in decadal LSSDs sorted in the order of latest to earliest) can be effectively applied to derive the decadal mean LSSDs (p<0.001). In comparison with the common linear and quadratic fitting approaches, the quasi-ʃ type Boltzmann fitting performs better (Table 2). While the linear regression being used, much uncertainty remains in the extrapolation (Jochner et al., 2016). In contrast, the fitted Boltzmann curve converges at the two ends (Figure 3), causing smaller extrapolation uncertainty. Therefore, for the records of extreme LSSDs, reconstruction by this method would not depict bias and error ranges as large as those produced by the linear function.
Table Infomation Is Not Enable
Figures 3a-3f also show that whether the calculated decadal mean LSSD is later than a certain date is related not only to the sample sizes, but also to the overall deviation degree of these samples. Specifically, only when the latest one for each 10-year interval and the average of the top 2, 3, 4, 5 and 8 LSSDs are later than April 3, March 25, March 21, March 18, March 15 and March 10, respectively, is it possible for the calculated decadal mean LSSD to be later than the modern mean LSSD—March 6 during 1951-1980. Thus, without the quantitative conversion, it is impossible to determine whether the decadal mean LSSD is late, only basing on one year or several years’ record.
Figure 3.
The relationships between the 10-year mean LSSD and 6 statistic indexes in Hangzhou. The dots are samples; the red solid lines are nonlinear trend lines fitted by the Boltzmann function; the blue dotted lines are prediction bands at the 95% confidence level; the green beelines refer to the six corresponding statistic values for the LSSDs in the decade when the 10-year mean LSSD is March 6.
4.3 Characteristics of the Hangzhou spring climate during Southern Song Dynasty
The Hangzhou mean LSSD during 1131-1270 was the proleptic calendar’s March 6, which is generally identical to the mean LSSD of 1951-1980. This indicates that Hangzhou’s spring climate at that time may have been as warm as that at present. Figures 4a and 4b further imply that the spring climate changed abruptly in 1171 or thereabouts. If so, the climate at that time can be divided into two periods at the century-scale: 1) The earlier period 1131-1170 was cold, in which the mean LSSD was March 10—four days later than that of 1951-1980. Within this period, two stages can be subdivided: the warming period of 1131-1154 and the cooling period of 1155-1170. 2) The later period 1171-1270 was a warm period with five subclimate stages, in which the mean LSSD was March 4—two days earlier than that of 1951-1980. During five subclimate stages, there are three subwarm periods, including 1171-1180 (mean LSSD: February 27), 1201-1220 (mean LSSD: March 4), 1241-1270 (mean LSSD: February 26), and two subcold periods, including 1181-1200(mean LSSD: March 8) and 1221-1240 (mean LSSD: March 11).
Figure 4.
Comparison of reconstructed climatic series for 1131-1270. (a) The inter-annual variations in the LSSD in Hangzhou and its abrupt change detection result of probability anomaly, ´ refer to 57 samples later than the perennial mean of the LSSDs, black line refers to the curve of probability distribution, and Southern Song Dynasty is taken as the reference period; (b) Reconstructed series of the LSSDs in Hangzhou with different temporal resolutions, the red step line refers to a 10-year temporal resolution, the sand-yellow step line refers to a 30-year temporal resolution, and the black Zero Anomaly line is the mean LSSD (March 6) during the reference period 1951-1980. (c) Decadal-scale variations in temperature at two other regions in 1131-1270, the orange line refers to the result revealed by historical documents in Central China (<xref ref-type="bibr" rid="b37">Wang <italic>et al</italic>., 2007</xref>), the green line refers to the result revealed by tree rings in Animaqin Mountains (<xref ref-type="bibr" rid="b4">Chen <italic>et al</italic>., 2016</xref>), the black Zero Anomaly line refers to the corresponding means in different reference periods (the past millennia for the former, and the past two millennia for the latter), the blue area indicates relatively cold periods, and the red area relatively warm periods. (d) Variations in the PDO index (<xref ref-type="bibr" rid="b25">Macdonald and Case, 2005</xref>) in 1131-1270, the yellow line refers to annual values, and the rose line refers to 11-point running averages.
At the 10-year and 30-year time scales, the mean LSSDs of the warmest periods and the coldest periods during Southern Song Dynasty were both later than those of 1951-2010, yet the amplitude was not greater. For the warmest 1260s and the coldest 1160s, the mean LSSD were February 18 and March 17, respectively. The corresponding amplitude is approximately 28 days.
By contrast, since 1951, the mean LSSDs during the warmest decade (2000s) and during the coldest decade (1960s) were February 7 and March 9, respectively. Thus, the decadal amplitude in LSSD during 1951-2010 is three days more than that during Southern Song Dynasty. Likewise, the 30-year amplitude in LSSD during 1951-2010 was worked out to be also three days more.
5 Discussion
5.1 The consistency between our reconstruction result and documentary evidences on climate
In eastern China, different seasons or different locations have much consistency in temperature variation (Ge et al., 2003; Ge et al., 2010). Our article also found this consistency during Southern Song Dynasty, by comparing reconstruction results with documentary evidences on climate. For example, the abrupt change of the climatic cycle from cold to warm in 1171 or thereabouts, inferred by the probability variation of LSSDs, was also implied by frequently recorded “warm winter” events (e.g. snow-free or ice-free phenomena) at Hangzhou during 1167-1170. When such warm winters frequently appeared again during 1195-1202, it is self-evident that the climate became warmer again in Southern Song Dynasty. Another consistency is about the warm peaks in 1154 or thereabouts during the subcold period 1131-1170. Our recognition can also be proved by two other poems. One poem was written by Zhang Jiucheng in Nan’an (present-day Dayu County, Jiangxi Province) in the winter of 1149, stating that it did not snow in the northern foothills of the Nanling Mountains during every winter from 1142 to 1148. Another poem was written by Cai Gui, which shows that the hammers, frequently used to break ice for the purpose of forcing passage along the Grand Canal in Jiangnan area, did not play their roles in the winter of 1153 because of no freezing in the river. Afterwards, the climate in eastern China turned cold again, such that during the 16 years from 1158 to 1173, only 3 years did not show records of LSSD in Hangzhou.
In addition to turning points of climate change, the decadal climate conditions during 1131-1270 that we have identified can also be found other documentary evidence, such as plant phenology, crop phenology, northern boundaries of crop planation, hydro-meteorological phenomena, and climate impressions. Among these decadal climate conditions, the coldness before 1200 and the warmness after 1200 have been discussed sufficiently (Chu, 1925a; Chu, 1925b; Chu, 1972; Zhang, 2009; Liu, 1982; Zhang, 1993; Man, 1993; Man, 2009), and we won’t give more details here. However, the warmness in the 1170s and the coldness in 1221-1240 were not discussed thoroughly in previous researches. For this reason, we supplemented some important documentary evidences. For example, peony festivals were held in Tianpeng (present-day Pengzhou City, Sichuan Province) during the Hanshi and Qingming solar terms (from April 5 to 7 Gregorian calendar) in the 1170s; in the same decade, winter wheat entered the dough stage in Beijing by the end of the Xiaoman solar term (from June 1 to 5 Gregorian calendar). In contrast, peony festivals in Pengzhou City are held on approximately April 10 now (Lan et al., 2002), which is at least three days later than that in the 1170s. The harvesting date of wheat (the late dough date) is around June 17 in Beijing (Wan, 1986). Because the initial dough period is generally 4-6 days earlier than the harvesting period (Jin, 1961), the present initial dough date is around June 11, more than six days later than that in the 1170s. Additionally, when the envoys of the Song Dynasty were sent to the Jin court in 1176, they reported that: “After we crossed the Huaihe River on Chinese calendar February 1 (March 20, 1176 Gregorian Calendar), fur coats were no longer needed… When we returned across Baigou River in middle and late March of the Chinese calendar, the weather was so hot that it could be comparable to that in May and June of the Chinese calendar in Jiangnan area.” Consequently, both these historical records and our climate reconstruction based on LSSD records suggest that the climate was warm all through eastern China in the 1170s.
In support of the coldness in the 1220s and 1230s, we found related phenological evidences from the Pingzhai Collection by poet Hong Zikui in Southern Song Dynasty and the Yishan Collection by poet Yuan Haowen in the Jin and Yuan dynasties. Hong Zikui returned to his hometown at Lin’an City in 1225, and since then pear tree blossoming during the Qingming solar term had been frequently described in his poems. As for Yuan Haowen, he was in custody for a long time in Guanxian County, Shandong Province, after the Jin Dynasty terminated in 1234. He also wrote a few poems describing bloomy apricot flowers during the Hanshi and Qingming solar terms during that period. However, at present, pear trees bloom in late March and early April in Hangzhou, and apricot flowers generally bloom in a few days before April 3 in Guanxian County. Therefore, the later spring phenological phenomena appeared from north to south in eastern China in 1221-1240.
5.2 The consistency between our reconstruction result and other reconstruction series
Compared with other climate reconstruction for Southern Song Dynasty (Chu, 1972; Ge et al., 2003), our present work has two main advantages: (1) a higher temporal resolution of 10 years; (2) a clearer revelation of the climatic changing feature by stages. More specifically, we revealed that the climate of Southern Song Dynasty turned from cold to warm in 1171 or thereabouts at the century scale, while previous studies generally indicated that the turning point was the year 1200. Besides, our reconstruction result showed a significant cooling period 1221-1240 in the late Southern Song Dynasty, which was not revealed previously. The improvements over the previous studies can be made mainly because we collected more detailed evidences on climate, converted Chinese-Western calendar more precisely, and utilized a more appropriate annual-decadal numerical conversion method.
To assess the validity of our reconstruction result for Hangzhou during Southern Song Dynasty (Figure 4b) further, we compared it with two other broad-scale temperature reconstructions in China (Figure 4c) at the same temporal resolution, including the millennium-long documentary series in central China (Wang et al., 2007), and the 2000-year reconstruction series based on tree ring in the Anyemaqen Mountains of the Tibetan Plateau (Chen et al., 2016). The coldness of approximately 1131-1150, the strong warming trend in 1161-1180, and the significant cooling trend in 1201-1250 in our reconstruction were all confirmed by the two other series. Additionally, Wang et al. (2007) regarded 1171-1270 as one of the two main multi-decadal warm periods in Eastern China during the MWP, which was also consistent with our reconstruction result at the 30-year scale. In general, the agreement between our reconstruction and other temperature reconstructions indicates that our series is reliable and can reflect the climate variation characteristics of Southern Song Dynasty in most regions of China.
In addition to the contrast of temperature reconstructions, we compared our reconstruction result to a circulation index series (Macdonald and Case, 2005), reflecting the variations of the Pacific Decadal Oscillation (PDO) (Figure 4d). Both series showed three warm periods (approximately 1170s, 1201-1220, and 1250s) and three cold periods (approximately 1131-1150, 1181-1200, and 1221-1240). Similar conclusion can be made when comparing the PDO series to the anomaly-snowfall index series based on documentary records in eastern China over the past 2000 years (Chu et al., 2008). In modern times, significant positive correlations were found at a 10-year resolution between winter temperature variations in most regions of China and the variation of the PDO (Liang et al., 2014). Furthermore, when the northern PDO in winter was at its warm phase, the following spring climate in most regions of eastern China was significantly warm (Wang et al., 2011). Additionally, under the ocean thermostatic mechanism, Walker Circulation had a significant influence on the climate of eastern monsoon region in China during the MWP (Liu et al., 2013). Overall, the PDO was one of the possible main forcing factors of temperature variations in most regions of China during Southern Song Dynasty.
5.3 Uncertainties of reconstruction result
The records of LSSD reflected only one type of typical weather event in Hangzhou. Although this type of event is statistically correlated with the spring temperature, relevant documentary evidences are only historical-climate proxy data. Moreover, different samples also have a significant influence on half-widths of the prediction intervals (Figure 3), when we converted intra-decadal LSSDs to decadal mean LSSD. Therefore, our reconstruction result inevitably has uncertainties.
Furthermore, historical references for the early and late periods of Southern Song Dynasty are much less than those for the other times during Song and Yuan dynasties (Man, 2009). Although we have collected many records of LSSD in these two periods, some other records at the same times were still missing. For example, during the period 1264-1274, which was in the reign of Emperor Du Zong (Zhao Qi), these phenomena were especially obvious. Before official historians had time to compile the historical annal for this emperor, Southern Song Dynasty had fallen rapidly. As a result, subsequent historical works, such as the Complete Literature of the History of Song Dynasty and the History of Song Dynasty, had no records of LSSD for the years after 1264 during Southern Song Dynasty. Therefore, missing historical records may have an uncertain effect on our reconstruction result. Additionally, the two latest spring snows in 1244 and 1258 was only recorded with months and had no exact dates. We conservatively estimated these dates as the first days of the two corresponding months, which also indicate that both the actual decadal means of LSSDs were more likely to be later than the calculated results in the present study.
6 Conclusions
China possesses rich and long-standing documentary records, which is invaluable for researching on global changes over the past two millennia. However, while related studies based on other climatic proxies have already made obvious progress in recent years, the use of historical proxy can still be improved in climatic information extraction and series reconstruction. Compared to previous studies focusing on the climate of Southern Song Dynasty by use of historical data, the present study made some new advances in data collections, Chinese-Western calendar conversions, the diagnosis of the proxy implications, annual-decadal index conversions, and the temporal resolution of reconstructed proxy series.
Through the above analysis, the following conclusions can be drawn: (1) LSSDs in Hangzhou during Southern Song Dynasty were historically recorded according to the excluding criteria of being earlier than the solar term Jingzhe in Chinese calendar and snow forms of ice pellets and graupels. This type of historical proxy has an explicit climate significance and can be used to reconstruct temperature changes. However, all dates should be converted into proleptic Gregorian style and meet the same criterion of solar terms as the Chinese calendar after 1929. (2) The forefront of LSSD in the decade can be used to calculate the decadal mean of LSSD through the Boltzmann fitting, whose extrapolation is better than those of linear and polynomial fittings. (3) The spring climate in Hangzhou during 1131-1270 was almost as warm as the period 1951-1980. At the centennial scale, it can be divided into two periods: the cold 1131-1170 and the warm 1171-1270. During the latter, 1181-1200 and 1221-1240 were two cold intervals at the multi-decadal scale. (4) The reconstructed LSSD series was consistent well with other documentary evidences and reconstructed climate series in China for 1131-1270, which may reflect the influence on the climate over most regions of China imposed by the PDO.
References
[1] CamuffoD, BertolinC, BarriendosM et al. 500-year temperature reconstruction in the Mediterranean Basin by means of documentary data and instrumental observations. Climatic Change, 101, 169-199(2010).
[2] Daily precipitation data in China during 1951 to 1970. Beijing: Central Weather Bureau, 1-681(1975).
[3] Weather days’ data in China during 1961 to 1970. Beijing: Central Weather Bureau, 1-741(1978).
[4] ChenF, ZhangY, Shao XM et al. A 2000-year temperature reconstruction in the Animaqin Mountains of the Tibet Plateau, China. Holocene, 26, 1904-1913(2016).
[5] Chu GQ, SunQ, Wang XH et al. Snow anomaly events from historical documents in eastern China during the past two millennia and implication for low-frequency variability of AO/NAO and PDO. Geophysical Research Letters, 35, 63-72(2008).
[6] ChuKochen. A conjecture on the climate changes during the South Song Dynasty. Chinese Science, 10(1925).
[7] ChuKochen. Climate changes over the Chinese history. Oriental Magazine, 22, 84-100(1925).
[8] ChuKochen. A preliminary study on the climatic fluctuations during the last 5000 years in China. Acta Archaeologica Sinica, 15-38(1972).
[9] Diaz HF, TrigoR, Hughes M K et al. Spatial and temporal characteristics of climate in Medieval Times revisited. Bulletin of the American Meteorological Society, 92, 1487-1500(2011).
[10] FangShimin, FangXiaofen. Calendars in Chinese History and Their Transformation to Western Calendars(1987).
[11] FeiJie, HouYongjian, LiuXiaodong et al. Fluctuation characteristics of climatic change in temperature of Tang Dynasty based on historical document records in South Loess Plateau. Collections of Essays on Chinese Historical Geography, 16, 74-81(2001).
[12] Ge QS, Zheng JY, Fang X Q et al. Winter-half-year temperature reconstruction for the middle and lower reaches of the Yellow River and Yangtze River, China, during the past 2000 years. Holocene, 16, 470-479(2003).
[14] GeQuansheng, ZhengJingyun, Hao Zhixin et al. State-of-the-arts in the study of climate changes over China for the past 2000 years. Acta Geographica Sinica, 69, 1248-1258(2014).
[15] Hughes MK, Diaz HF. Was there a medieval warm period, and if so, where and when?. Climatic Change, 26, 109-142(1994).
[16] JiangXiaoyuan. Julian calendar or Gregorian calendar? It’s a problem!. Chinese National Astronomy(2007).
[17] JinXibo. Wheat Cultivation in China., 584-585(1961).
[18] JochnerS, Sparks TH, LaubeJ et al. Can we detect a nonlinear response to temperature in European plant phenology?. International Journal of Biometeorology, 60, 1551-1561(2016).
[19] LanBaoqing, LiJiajue, Duan Quanxu et al. Chinese Tree Peony Encyclopedia., 23-24(2002).
[20] LiangSujie, DingYihui, ZhaoNan et al. Analysis of the inter-decadal changes of the wintertime surface air temperature over mainland China and regional atmospheric circulation characteristics during 1960-2013. Chinese Journal of Atmospheric Sciences, 38, 974-992(2014).
[21] LiuChuanfeng, GaoBo. Climate of chilling damage in spring in southern China and its atmospheric circulation features. Journal of Tropical Meteorology, 17, 179-187(2001).
[22] LiuJ, WangB, Cane MA et al. Divergent global precipitation changes induced by natural versus anthropogenic forcing. Nature, 493, 656-659(2013).
[23] Liu XQ, Yu ZT, Dong H L et al. A less or more dusty future in the northern Qinghai-Tibetan Plateau?. Scientific Reports, 4, 6672(2014).
[24] LiuZhaoming. Climate Changes over the Chinese History., 128-130(1982).
[25] Macdonald GM, Case RA. Variations in the Pacific Decadal Oscillation over the past millennium. Geophysical Research Letters, 32, 93-114(2005).
[26] ManZhimin. A verification of the latest spring snowing dates in Hangzhou in the Southern Song Dynasty. Research on Historical Geography, 107-111(1990).
[27] ManZhimin. The climate condition from North Song to Yuan Dynasty in Huang-Huai-Hai Plain. Historical Geography, 75-88(1993).
[28] ManZhimin. The reply to Mr. Zhao Zhile about the problems of historical climate research. Collections of Essays on Chinese Historical Geography, 19, 121-128(2004).
[29] ManZhimin. The Study on Climate Change in Historical Period of China., 21-71(2009).
[30] Mo?nyM, BrázdilR, DobrovolnyP et al. Cereal harvest dates in the Czech Republic between 1501 and 2008 as a proxy for March-June temperature reconstruction. Climatic Change, 110, 801-821(2012).
[31] . Surface Temperature Reconstructions for the Last 2,000 Years., 1-24(2006).
[32] Science Plan and Implementation Strategy. IGBP Report No.57. IGBP Secretariat, Stockholm. 67pp.(2009).
[33] PfisterC, BrázdilR, GlaserR et al. Documentary evidence on climate in sixteenth-century Europe. Climatic Change, 43, 55-110(1999).
[34] QuAnjing. Chinese Mathematical Astronomy.(2008).
[35] WanMinwei. A Compilation of Natural Calendars in China.(1986).
[36] WangLin, ChenWen, FongRuiquan et al. The seasonal march of the North Pacific Oscillation and its association with the inter-annual variations of China’s climate in boreal winter and spring. Chinese Journal of Atmospheric Sciences, 35, 393-402(2011).
[37] WangShaowu, WenXinyu, Luo Yong et al. Reconstruction of temperature series of China for the last 1000 years. Chinese Science Bulletin, 52, 3272-3280(2007).
[38] WangXin, YangBo. Research progresses in reconstructions of temperature and external forcing factors in China and Northern Hemisphere over the past 2000 years. Journal of Desert Research, 38, 829-840(2018).
[39] Xu GB, Liu XH, ZhangQ et al. Century-scale temperature variability and onset of industrial-era warming in the eastern Tibetan Plateau. Climate Dynamics, 53, 4569-4590(2019).
[40] XuXiqi. A New Chinese Calendar for Three Thousand Years.(1992).
[41] XueZhongsan, OuyangYi. A Sino-Western Calendar for Two Thousand Years(1956).
[42] Yao TD, Duan KQ, Thompson L G et al. Temperature variations over the past millennium on the Tibetan Plateau revealed by four ice cores. Annals of Glaciology, 46, 362-366(2007).
[43] ZhangDe’er. A study on the Medieval Warm Period in China. Quaternary Sciences, 7-15(1993).
[44] ZhangPeiyu. Calendars and Astronomical Phenomena for the Past 3500 Years.(1997).
[45] ZhangPiyuan et al. Climate Changes in China during Historical Times., 195-440(1996).
[46] ZhangQuanming. The climate changes in Zhejiang Province during South Song Dynasty. Collections of Essays on the Song Dynasty History, 1-29(2009).
[47] ZhangY, Shao XM, Yin ZY et al. Millennial minimum temperature variations in the Qilian Mountains, China: Evidence from tree rings. Climate of the Past, 10, 1763-1778(2014).
[48] ZhaoZhile. A few viewpoints on ancient climate research: Take the thesis of the climate condition from North Song to Yuan Dynasty in Huang-Huai-Hai Plain as example. Collections of Essays on Chinese Historical Geography, 19, 136-142(2004).
Haolong LIU, Junhu DAI, Junhui YAN, Fanneng HE, Quansheng GE, Chongxing MU. Temperature variations evidenced by records on the latest spring snowing dates in Hangzhou of eastern China during 1131-1270AD[J]. Journal of Geographical Sciences, 2020, 30(10): 1664