2International Quantum Academy, Shenzhen 518048, China
3Shenzhen Institute for Quantum Science and Engineering, Southern University of Science and Technology, Shenzhen 518055, China
4Department of Optics and Optical Engineering, University of Science and Technology of China, Hefei 230026, China
5Key Laboratory of Specialty Fiber Optics and Optical Access Networks, Shanghai University, Shanghai 200444, China
6Key Laboratory of Radar Imaging and Microwave Photonics, Ministry of Education, Nanjing University of Aeronautics and Astronautics, Nanjing 210016, China
7Hefei National Laboratory, University of Science and Technology of China, Hefei 230088, China
The foundry development of integrated photonics has revolutionized today’s optical interconnect and datacenters. Over the last decade, we have witnessed the rising of silicon nitride () integrated photonics, which is currently transferring from laboratory research to foundry manufacturing. The development and transition are triggered by the ultimate need for low optical loss offered by , which is beyond the reach of silicon and III-V semiconductors. Combined with modest Kerr nonlinearity, tight optical confinement, and dispersion engineering, has today become the leading platform for linear and Kerr nonlinear photonics, and it has enabled chip-scale lasers featuring ultralow noise on par with table-top fiber lasers. However, so far all the reported fabrication processes of tight-confinement, dispersion-engineered photonic integrated circuits (PICs) with optical loss down to few dB/m have only been developed on 4-inch (100 mm diameter) or smaller wafers. Yet, to transfer these processes to established CMOS foundries that typically operate 6-inch or even larger wafers, challenges remain. In this work, we demonstrate the first foundry-standard fabrication process of PICs with only 2.6 dB/m loss, thickness above 800 nm, and near 100% fabrication yield on 6-inch (150 mm diameter) wafers. Such thick and ultralow-loss PIC enables low-threshold generation of soliton frequency combs. Merging with advanced heterogeneous integration, active ultralow-loss integrated photonics could pave an avenue to addressing future demands in our increasingly information-driven society.
1. INTRODUCTION
Integrated photonics [1] enables the synthesis, processing, and detection of optical signals using the photonic integrated circuit (PIC). The successful translation from laboratory research to foundry development over the past decades has established integrated photonics as a standard technology [2] deployed in high-data-rate telecommunication and datacenters [3]. Foundry-level manufacturing of photonic chips allows fast prototyping or mass production with high yield, high throughput, low cost, and guaranteed performance.
Silicon (Si) and indium phosphide (InP) are two mainstream platforms of integrated photonics [4]. The development of heterogeneous integration [5,6] has married these two platforms and created the first electrically pumped InP/Si lasers [7,8] that have today been used for optical interconnect. Despite that, Si and InP still have many limitations, particularly the high linear and nonlinear losses (e.g., two-photon absorption) that compromise their performance.
To address this challenge, silicon nitride () has emerged as a leading platform for low-loss integrated photonics [9–11]. The 5 eV bandgap of makes it transparent from ultraviolet to mid-infrared, and immune to two-photon absorption in the telecommunication band. Meanwhile, has a dominant Kerr nonlinearity but negligible Raman [12] and Brillouin nonlinearities [13]. In addition, with advanced CMOS fabrication techniques, linear optical loss down to 1 dB/m or even lower has been only achieved in [14–19] among all integrated platforms. All these advantages have triggered the rapid development of Kerr nonlinear photonics [9,10] and have enabled key advances such as optical frequency comb generation [20–22], supercontinuum generation [23–25], and quantum light sources [26–28]. In addition to ultralow loss, tight optical confinement with cladding is simultaneously required. Since the refractive index of () is modestly higher than that of (), waveguides require sufficient thickness to achieve tight optical confinement for small mode volume and for bending radii down to 20 μm. In addition, while material has intrinsic normal group velocity dispersion (GVD) at telecommunication bands, waveguides with thickness above 600 nm can obtain net anomalous GVD that is required for phase matching in Kerr parametric processes [29,30].
Sign up for Photonics Research TOC. Get the latest issue of Photonics Research delivered right to you!Sign up now
While CMOS foundries have already developed standard processes [31] to fabricate PIC with typical thickness of 300 nm and loss on the order of 10 dB/m, there has not been a process to simultaneously achieve ultralow loss (e.g., below 3 dB/m) and large thickness (above 600 nm) without crack formation. So far, thin PIC with a width above 5 μm and thickness below 100 nm [17–19] can achieve optical loss below 0.1 dB/m. While this process has recently become an 8-inch (200 mm diameter) foundry process [32], the thin exhibits weak optical confinement and, thus, suffers from exaggerated bending loss with a small footprint. The optical mode also exhibits strong normal GVD due to the waveguide geometry. While coupled waveguide structures can be used to alter local GVD [33,34], they cannot offer anomalous GVD over a wide spectral range. In parallel, a thick PIC of ultralow loss and broadband anomalous GVD has been realized via the subtractive process [35–37] and the photonic Damascene process [14,38]. However, all these reported processes have been developed only in laboratories and have issues with transferring to foundry manufacturing. While high-yield, wafer-scale fabrication of PIC has achieved 1 dB/m loss and anomalous GVD in Ref. [14], the photonic Damascene process has intrinsic limitations. For example, the use of chemical-mechanical planarization (CMP) to remove excess can cause a serious dishing effect in large-area structures (see Appendix C) and, thus, cannot be used to fabricate elements such as arrayed waveguide gratings (AWGs) and multimode interferometers (MMIs). Meanwhile, the aspect-ratio-dependent etch effect prevents the formation of narrow but deep channels [39]. In comparison, with the subtractive process [35–37], a thick PIC of ultralow loss and anomalous GVD has been only achieved with electron-beam lithography (EBL) on 3- or 4-inch wafers, which are not foundry-standard. Meanwhile, an 8-inch foundry process has been developed in Ref. [40], but this process has not yet achieved optical loss below 3 dB/m.
In this work, we overcome the above challenges and demonstrate a foundry-standard fabrication process of tight-confinement, dispersion-engineered, ultralow-loss PIC. The process is based on 6-inch (150 mm diameter) wafers and combines deep-ultraviolet (DUV) stepper lithography [14] and state-of-the-art subtractive process [37], i.e., a DUV subtractive process. We have achieved a linear optical loss of 2.6 dB/m in 810-nm-thick PIC. Finally, we generate single-soliton microcombs of 100.17 GHz and 19.975 GHz mode spacings using these devices.
2. FABRICATION
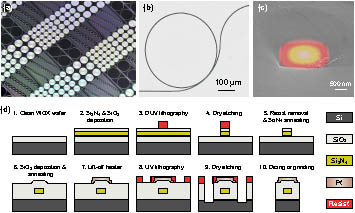
Figure 1(a) presents a photograph that shows dozens of chips on a 6-inch wafer, which contains microresonators of different free spectral ranges (FSRs) and meter-long spirals. Figure 1(b) presents an optical micrograph that shows a curved bus waveguide slowly approaching a 100-GHz-FSR microring resonator for light coupling. This coupler design can increase coupling strength and ideality, which will be described later. Figure 1(c) presents a scanning electron microscopy (SEM) image that shows the actual waveguide cross section with 85° sidewall angle and overlaid fundamental transverse-electric () mode. The optical mode is tightly confined in the waveguide core with cladding, enabling dispersion engineering and small bending radii.
Figure 1.Process flow and sample images of the 6-inch foundry fabrication process. (a) Photograph of dozens of chips on a 6-inch wafer, which contains microresonators of different FSR and meter-long spirals. (b) Optical micrograph showing a curved bus waveguide slowly approaching a 100-GHz-FSR microring resonator. (c) SEM image showing the waveguide core with cladding. The mode is plotted, showing tight confinement in the waveguide core. (d) DUV subtractive process flow. WOX, wet oxide ().
The PIC is fabricated using the DUV subtractive process. Figure 1(d) shows the subtractive process flow widely used to fabricate PIC based on essentially any material, particularly [35–37,40–44]. First, a film is deposited on a clean thermal wet substrate via low-pressure chemical vapor deposition (LPCVD). It is well known that LPCVD films are prone to crack due to their intrinsic tensile stress (typically 1.1–1.4 GPa). The film stress can be relaxed via thermal cycling during deposition in multiple layers [40,41], yielding zero cracks during our fabrication. After deposition as an etch hardmask, DUV stepper photolithography is used to expose the waveguide pattern. Via dry etching, the pattern is subsequently transferred from the photoresist mask to the hardmask and then into the layer to form waveguides. For superior etch quality and smooth waveguide sidewall, the etchant we use is with added to remove fluoride-carbon polymers as etch byproducts.
The etched substrate is thermally annealed in nitrogen atmosphere at 1200°C to eliminate nitrogen-hydrogen bonds in , which cause absorption loss. Top cladding is then deposited on the wafer, which also requires high-temperature annealing to remove silicon–hydrogen bonds that also cause absorption loss. In specific cases where deuterated plasma-enhanced chemical vapor deposition (PECVD) [44,45] and [46] are used, thermal annealing may not be required as these films are intrinsically hydrogen-free.
Platinum heaters [22,47] are deposited on the substrate via an evaporator and patterned via a lift-off process. Due to the thick top cladding and tight optical confinement of the core, the presence of metallic heaters does not impact the optical loss of waveguides beneath. Afterward, UV photolithography and deep dry etching of and Si are used to define chip size and create smooth chip facets. Finally, the wafer is separated into chips using dicing or backside grinding.
3. CHARACTERIZATION
A. Microresonator Quality Factors and Loss Rates
We characterize the optical loss of PIC by measuring the resonance linewidth of microresonators. Light is coupled into and out of chips via lensed fibers and inverse tapers [39]. The fiber-chip edge coupling efficiency is about 60%. We use frequency-comb-assisted diode laser spectroscopy [48] to measure resonance frequency and linewidth , ranging from 1480 to 1640 nm wavelength. The resonance’s quality factor is calculated as . Here we study both the and (fundamental transverse-magnetic) modes of the 100-GHz-FSR microresonators of 810 nm thickness and 2.40 μm waveguide width. For each resonance fit [49], the intrinsic loss , external coupling strength , and total (loaded) linewidth are extracted.
Figure 2(a) shows a typical resonance with a Lorentzian fit. The resonance is under-coupled (), with fitted . Figure 2(b) shows a histogram of for 11,741 fitted resonances from sixty 100-GHz-FSR microresonators. The most probable value is , corresponding to a statistical intrinsic quality factor of . The microresonator and linear optical loss (dB/m physical length) are linked via At telecommunication band and with a group index for the given waveguide geometry, corresponds to . In comparison, is found for the mode, corresponding to (see Appendix A). The wavelength-dependent loss of each resonance is studied in Appendix B, showing no prominent hydrogen-related absorption around 1520–1540 nm.
Figure 2.Statistical loss characterization and yield analysis. (a) Typical resonance profile with a Lorentzian fit, showing and negligible mode split. (b) Histogram of 11,741 resonances from sixty 100-GHz-FSR microresonators of 2.40 μm waveguide width, showing the most probable value of and . (c) Characterization of waveguide-width-dependent loss. Microresonators of 2.40, 2.20, 2.00, and 1.80 μm waveguide widths are characterized and compared. A trend of lower with a larger width is shown. The size and color tone of the circles indicate the probability of occurrence. (d) Uniformity and yield analysis over the 6-inch wafer scale. Right, the DUV stepper reticle layout contains 16 chips and is uniformly exposed in discrete fields over the 6-inch wafer. Left, the most probable values of the C11 chips, as well as the measured GVD parameters , are marked in each field over the wafer. NA: not applicable, due to visible defects or missing C11 chips near wafer edge.
Next, we investigate wafer-scale fabrication yield. The right of Fig. 2(d) shows our design layout containing 16 chips on the DUV stepper reticle. Each chip has a size on the wafer and contains many microresonators. The DUV stepper exposes the reticle uniformly over the 6-inch wafer in discrete fields. The 100-GHz-FSR chips characterized above are labeled as the C11 chips. The most probable values for all C11 chips, as well as their GVD parameters (described later), are plotted in each field, as shown in the left of Fig. 2(d). In all measured 20 fields, is found, demonstrating that our foundry process to manufacture ultralow-loss PIC is uniform and near 100% yield.
We also characterize of 100-GHz-FSR microresonators of 2.20, 2.00, and 1.80 μm waveguide width. Again, we create a histogram for each case and look for the most probable values. We plot and compare the most probable values for the three width values and observe a decreasing with increasing waveguide width, as shown in Fig. 2(c). This trend indicates that our optical loss is still dominated by the waveguide’s interface roughness and can be further reduced by optimizing the dry etching process or using CMP to reduce top surface roughness [36].
B. Microresonator Dispersion
For most applications using Kerr nonlinearity of , anomalous GVD is required [29,30]. In addition, for the generation of dissipative Kerr solitons [20,50,51], avoided mode crossings (AMX) induced by spatial mode coupling [52] should be suppressed, as they prohibit soliton formation [53,54] or distort soliton spectra [55,56]. Therefore, next we quantitatively characterize the dispersion profile and investigate AMXs of the high-, 100-GHz-FSR microresonators. The microresonator’s integrated dispersion is defined as where is the th resonance frequency relative to the reference resonance frequency , is microresonator FSR, describes GVD, and and are higher-order dispersion terms. The top of Figure 3(a) shows a typical profile, with each parameter extracted from the fit Eq. (2). The positive sign of validates anomalous GVD. To reveal AMXs, we remove the term and fit the data with , as shown in the middle of Fig. 3(a). We further remove the and terms, and fit the data with , as shown in the bottom of Fig. 3(a). The observed AMXs are overall weak and only lead to megahertz-level resonance frequency deviation. It also shows that, with these weak AMXs, our spectroscopic method is sufficiently precise to extract the term.
Figure 3.Characterization of microresonator dispersion and coupling ideality. (a) Measured integrated dispersion of the microresonator that is fitted with (top), the resonance frequency deviations from (middle), and the deviations from (bottom). Avoided mode crossings are revealed in the bottom panel, however weak for the later soliton generation experiment. (b) Characterization of coupling ideality of the (top) and (bottom) modes. For the modes, in total thirty-four/seventeen 100-GHz-FSR microresonators are characterized, providing 3269/959 data points in each plot. A clear trend from under-coupling to critical coupling and then to strong over-coupling is observed. The calculated curves of with or 17 MHz are plotted for comparison, showing near-unity coupling ideality.
Furthermore, we experimentally characterize the coupling ideality [57] of our high- microresonators. In the current case, light in the bus waveguide’s fundamental TE mode () is coupled into the microresonator’s fundamental TE mode () and then coupled out of the microresonator and back into the bus waveguide. In this process, coupling ideality is defined as Here is the external coupling rate between the and modes, and is the parasitic loss rate describing coupling strength to other bus waveguide modes as well as radiation modes into free space. The parasitic loss appears as another loss channel in addition to and . Thus, is a parameter describing how much power is recollected in the mode that is exactly the initial driving mode of the bus waveguide [57,58]. In the ideal case of single-mode bus waveguide and no radiation into free space, is obtained. In the present case, the bus waveguide is multimode, since it has the same waveguide cross section (thickness × width) as the microresonator waveguide, to obtain phase matching between the and modes for maximum . Thus, the mode can couple to other bus waveguide modes (e.g., higher-order TE modes or any TM modes) or radiation modes, which ultimately compromises coupling ideality ().
With a sufficient number of characterized resonances, coupling ideality is evaluated by analyzing the dependence of resonance transmission and total linewidth , as where describes the coupling regime ( for under-coupling, for critical coupling, and for over-coupling [59]). Previously, coupling ideality of integrated microresonators has been characterized [58], however, based on devices of . For state-of-the-art microresonators of , coupling ideality has not been experimentally studied, and whether high coupling ideality is still maintained needs to be answered.
Here we perform extra measurement on over-coupled devices with smaller gap values down to 300 nm. The microresonators are identical, except that the gap varies from sample to sample to provide a varying . Figure 3(b) shows the measured coupling ideality for the and modes from dozens of 100-GHz-FSR microresonators. The [top of Fig. 3(b)] and [bottom of Fig. 3(b)] plots contain 3269 and 959 data points, respectively. The data are sufficient to uncover the global trend even in the presence of variation due to fabrication and AMXs. Meanwhile, for comparison, we also plot the - curves with , calculated using Eq. (4). As can be seen, our microresonators coupled with curved bus waveguides can already provide near-unity and strong over-coupling (e.g., for the ), which are critical for microring-based phase modulation [60,61], wideband tunable delay lines [62], and the extraction of quantum light states generated in high- microresonators [27,63–65].
4. SOLITON MICROCOMB GENERATION
A key application area of our PIC is Kerr nonlinear photonics, where ultralow optical loss is central as it determines the threshold power for Kerr parametric oscillation [29]. For example, for soliton microcomb generation [20,50,51], scales with the microresonator factor as . Therefore, with this quadratic dependence, a high enables significant reduction of down to milliwatt level.
The experimental setup to generate single solitons in our chips is shown in Fig. 4(a). We note that, due to the high- and low thermal effects of our microresonators, single solitons can be generated via simple laser-piezo frequency tuning [50,66] or on-chip heaters [22,47]. This is in contrast to many soliton generation experiments that require sophisticated techniques to manage thermal effects [67], such as power kicking [68,69], single-sideband suppressed-carrier frequency shifters [70], dual-laser pump [71,72], pump modulation [73,74], pulse pumping [75], or laser self-cooling [76].
Figure 4.Single-soliton generation in silicon nitride. (a) Experimental setup. AFG, arbitrary function generator; ECDL, external-cavity diode laser; EDFA, erbium-doped fiber amplifier; BPF, bandpass filter; EOM, electro-optic modulator; DUT, device under test; FBG, fiber Bragg grating; PD, photodiode; OSA, optical spectrum analyser; OSC, oscilloscope; VNA, vector network analyzer. (b) When the laser frequency is scanned from the blue-detuned to the red-detuned side of a resonance, a soliton step of sub-millisecond length appears, enabling direct access to soliton states via simple piezo tuning of laser frequency. (c) Cavity response measurement using the EOM and VNA. The appearance of -resonance verifies soliton generation. (d) Single-soliton spectra of 100.17 GHz mode spacing, with 19 mW (red) and 126 mW (blue) CW pump power on the chip, and their spectral fit (green). With 19/126 mW power, the arrows mark the 3 dB bandwidth of 17.99/35.68 nm. A prominent Raman self-frequency shift of 10.4 nm is observed with 126 mW power. (e) Single-soliton spectrum of 19.975 GHz mode spacing with 518 mW (blue) CW pump power on the chip and its spectral fit (green). The arrows mark the 3 dB bandwidth of 21.96 nm, containing 137 comb lines. In both (d) and (e), the EDFA’s amplified spontaneous emission (ASE) noise is filtered out by the BPF, and the pump laser in the soliton spectra is filtered out by the FBG.
When the continuous-wave (CW) pump laser’s frequency scans across a resonance from the blue-detuned side to the red-detuned side, a step feature (i.e., the “soliton step”) is observed in the microresonator transmission spectrum [50], signaling soliton formation. Figure 4(b) shows a typical soliton step with sub-millisecond duration, sufficiently long for accessing the single-soliton state via simple laser-piezo frequency tuning [50,66]. To further confirm the soliton nature and measure the soliton detuning value, a system response measurement using an electro-optic modulator (EOM) and a vector network analyzer (VNA) is performed [66]. As shown in Fig. 4(c), the system response features double resonances corresponding to the cavity resonance of the CW pump (“-resonance”), and the soliton-induced resonance (“-resonance”). Physically, the “cold” cavity resonance is probed by the intracavity low-power CW as a background to the soliton pulse pattern; thus, the observed -resonance frequency indicates the effective laser-cavity detuning (where thermal induced resonance shift is eliminated) [66]. The -resonance is induced by the soliton pattern that has a high peak-power leading to nonlinear frequency shift of the cavity resonance.
As shown in Fig. 4(d), in a 100-GHz-FSR microresonator, a single soliton of 100.17 GHz mode spacing is generated with 19 mW power in the bus waveguide on-chip. The spectrum fit shows 3 dB bandwidth of 17.99 nm, corresponding to a Fourier-limited pulse duration of 141.8 fs. Increasing the pump power to 126 mW and the pump laser detuning, the soliton’s 3 dB spectrum bandwidth is increased to 35.68 nm (pulse duration of 71.47 fs). We also observe a strong Raman-induced self-frequency shift [77,78] of 10.4 nm. Moreover, we generate a single soliton in a 20-GHz-FSR microresonator from the same wafer. Figure 4(e) shows the single-soliton spectrum of 19.975 GHz mode spacing with 518 mW power in the bus waveguide. The 3 dB bandwidth of 21.96 nm, corresponding to a pulse duration of 115.4 fs, covers 117 comb lines. This coherent soliton microcomb with a microwave K-band repetition rate is advantageous for applications such as high-spectral-efficiency telecommunications [79,80], photonic microwave generation [81–83], and astronomical spectrometer calibration [84,85]. Previously, among all CMOS-compatible high-index materials, single-soliton microcombs of repetition rates below microwave K-band () have only been realized in , using either the 4-inch photonic Damascene process [82], or the 3-inch EBL-written subtractive process [86]. Our work represents the first foundry-based, 6-inch subtractive process with DUV stepper lithography to reach this goal.
5. CONCLUSION AND OUTLOOK
In conclusion, we have reported a 6-inch foundry fabrication process of tight-confinement, dispersion-engineered PIC of optical loss down to 2.6 dB/m and near 100% yield. We have demonstrated its application in soliton microcomb generation with low power threshold and dense channel spacings. While currently our process is based on 6-inch wafers due to our dry etcher, essentially our process can be scaled up to an 8-inch (200 mm diameter) process, which can offer even better uniformity and higher throughput. Merging our ultralow-loss process with established heterogeneous integration [87,88] can introduce a variety of active functions to the passive PIC, such as narrow-linewidth lasers in the UV and visible bands [89,90], broadband EOMs [91,92], fast photodetectors [93,94], and programmable MEMS-controlled networks [95,96]. Together, foundry development of heterogeneous, ultralow-loss integrated photonics could revolutionize next-generation applications for frequency metrology [97,98], photonic neural networks [99,100], and quantum information processing [101,102].
Acknowledgment
Acknowledgment. J. Liu is indebted to Dapeng Yu who provided critical support for this project. We thank Chao Xiang for the fruitful discussion. J. Liu acknowledges support from the National Natural Science Foundation of China, Hetao Shenzhen-Hong Kong Science and Technology Innovation Cooperation Zone Project, and the Guangdong Provincial Key Laboratory. Y.-H. L. acknowledges support from the China Postdoctoral Science Foundation. J. Liu and Z. Y. conceived the fabrication process. Z. Y., H. J., and Z. H. developed the fabrication process and fabricated the samples. C. S. took the SEM images and provided support in the fabrication. J. Long, B. S., Y.-H. L., and W. S. built the experiment and characterized the samples, while H. G., J. H., and Z. Y. provided support and suggestions. W. S., J. Long, and J. H. performed the soliton generation experiment. L. G. took the photos of the sample. Y.-H. L, B. S., and J. Liu analyzed the data and prepared the paper with input from others. J. Liu supervised the project and managed the collaboration.
APPENDIX A: CHARACTERIZATION OF THE MICRORESONATOR TM00
Figure 5(a) shows a resonance with a Lorentzian fit. The resonance is critically coupled (), with fitted . Figure 5(b) shows a histogram of for 7944 fitted resonances from forty 100-GHz-FSR microresonators. The most probable value is , corresponding to . Figure 5(c) shows the most probable values for all C11 chips plotted in each field of the 6-inch wafer, as well as their GVD parameters . In all measured 20 fields, is found.
Figure 5.Characterization of the microresonator mode. (a) Typical resonance profile with a Lorentzian fit, showing . (b) Histogram of 7944 resonances from forty 100-GHz-FSR microresonators of 2.40 μm waveguide width, showing the most probable value of and . (c) Uniformity and yield analysis over the 6-inch wafer scale. Right, the DUV stepper reticle layout contains 16 chips and is uniformly exposed in discrete fields over the 6-inch wafer. Left, the most probable values of the C11 chips, as well as the measured GVD parameters , are marked in each field over the wafer. NA: not applicable, due to visible defects or missing C11 chips near wafer edge.
We use frequency-comb-assisted diode laser spectroscopy [48] to measure resonance frequency and linewidth , ranging from 1480 to 1640 nm wavelength. Figure 6 shows the measured and fitted intrinsic loss , the external coupling strength , and the total (loaded) linewidth of each resonance of a typical 100-GHz-FSR microresonator. Since the bus waveguide and the microresonator are coupled via evanescent field, is wavelength-dependent with a given geometry. Therefore, the alignment of values on a line indicates correct resonance fit with reasonable precision. Local increase is observed at multiple wavelengths; however, such narrowband features are likely caused by AMXs. In addition, no prominent hydrogen-related absorption around 1520–1540 nm is observed, indicating low photo-thermal absorption.
Figure 6.Broadband measurement of resonance linewidth. Measured and fitted , , and of each resonance from 1480 to 1640 nm. The alignment of values on a line indicates correct resonance fit with reasonable precision. Local increase at multiple wavelengths is likely caused by AMXs. No prominent hydrogen-related absorption around 1520–1540 nm is observed.
Our reported process is based on the subtractive process that is a top-down process where waveguides are formed by dry etching. There is another process widely used for the fabrication of ultralow-loss PIC, i.e., the photonic Damascene process [14,38]. This process is an “additive” process. As illustrated in Ref. [14], the patterns are transferred from the photoresist mask to the substrate to create waveguide preforms. Then, an LPCVD film is deposited on the patterned substrate, filling the preform trenches and forming the waveguides. CMP is used to remove excess and create a flat and smooth wafer top surface. The rest steps are the same as the subtractive process.
It should be noted that the dishing effect, illustrated in Fig. 7, is commonly presented if the CMP polishing rates for the waveguide material and cladding are different (which is true for and ). In the Damascene case, the CMP slurry containing nano-particles makes the polishing rate of higher than that of thermal wet , which induces the dishing effect in large-area patterns (e.g., critical dimension larger than 3 μm). The dishing effect leads to significant structure distortion and top surface roughness.
Figure 7.Illustration of the CMP dishing effect observed during fabrication. (a) SEM images showing smooth top surface after CMP for waveguides with smaller critical dimension (e.g., below 3 μm). (b) SEM images showing rough top surface due to the CMP dishing effect for waveguides with larger critical dimension (above 3 μm).