
Guanqun Huo, Jinbo Lu, Shengxiang Luo. Image Stitching Based on CLAHE and Improved ZNCC[J]. Laser & Optoelectronics Progress, 2022, 59(12): 1211003
- Laser & Optoelectronics Progress
- Vol. 59, Issue 12, 1211003 (2022)
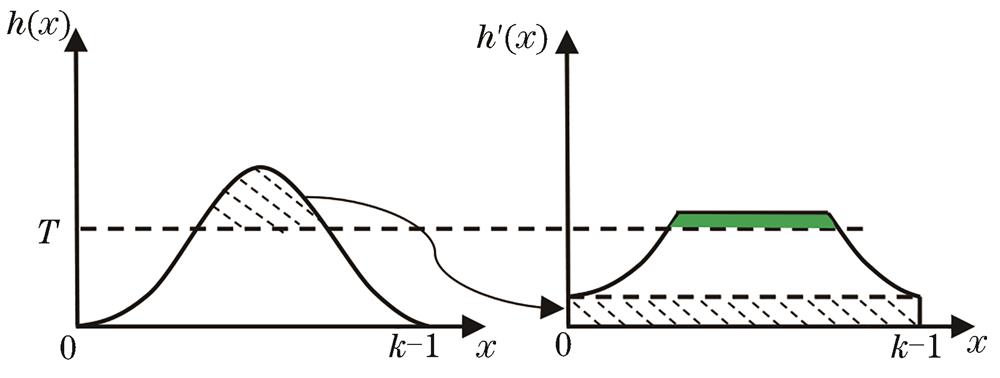
Fig. 1. Histogram clipping
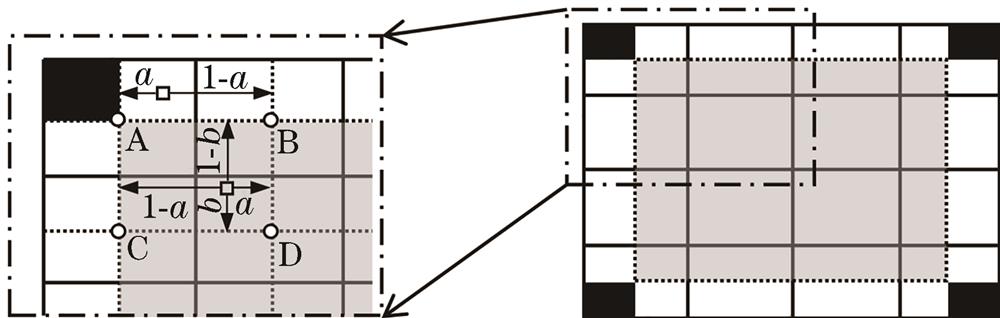
Fig. 2. Interpolation operation
Fig. 3. Process of enhancing image contrast
Fig. 4. After contrast enhancement, feature point extraction and matching results. (a) Traditional method; (b) proposed method
Fig. 5. Schematic of sampling window rotation
Fig. 6. The first and last images of the tested image sequence. (a) bark group; (b) leuven group; (c) bikes group
Fig. 7. Comparison of number of correct matching points in the bark group obtained by different algorithms
Fig. 8. Comparison of number of correct matching points in the leuvne group obtained by different algorithms
Fig. 9. Comparison of number of correct matching points in the bikes group obtained by different algorithms
Fig. 10. Original images of mosaic image. (a) The first group; (b) the second group; (c) the third group
Fig. 11. The first group. (a) Direct extraction; (b) contrast enhanced by the proposed algorithm and then extraction; (c) screening by the proposed algorithm
Fig. 12. The second group. (a) Direct extraction; (b) contrast enhanced by the proposed algorithm and then extraction; (c) screening by the proposed algorithm
Fig. 13. The third group. (a) Direct extraction; (b) contrast enhanced by the proposed algorithm and then extraction; (c) screening by the proposed algorithm
Fig. 14. Image mosaic results of the first group. (a) Classical SIFT algorithm; (b) algorithm in Ref. [2]; (c) proposed algorithm
Fig. 15. Image mosaic results of the second group. (a) Classical SIFT algorithm; (b) algorithm in Ref. [2]; (c) proposed algorithm
Fig. 16. Image mosaic results of the third group. (a) Classical SIFT algorithm; (b) algorithm in Ref. [2]; (c) proposed algorithm
| |||||||||||||||||||||||||||||||||||||||||||||||||||||||||||||||||||||||||||||||||||||||||
Table 1. Comparison of number of correct matching points and correct matching rate obtained by using different window sizes and different thresholds
|
Table 2. Correct matching rate of each group of images under different algorithms
|
Table 3. Correct matching rate of each group of images before and after using proposed algorithm

Set citation alerts for the article
Please enter your email address
© Copyright 2018-2021 | Chinese Laser Press. All Rights Reserved 沪ICP备15018463号-20