• High Power Laser Science and Engineering
  • Vol. 5, Issue 3, 03000e17 (2017)
I. Prencipe1、†, J. Fuchs2, S. Pascarelli3, D. W. Schumacher4, R. B. Stephens5, N. B. Alexander6, R. Briggs3, M. Büscher7、8, M. O. Cernaianu9, A. Choukourov10、11, M. De Marco10, A. Erbe12、13, J. Fassbender12、13, G. Fiquet14, P. Fitzsimmons6, C. Gheorghiu9, J. Hund15, L. G. Huang1, M. Harmand14, N. J. Hartley1, A. Irman1, T. Kluge1, Z. Konopkova16, S. Kraft1, D. Kraus1, V. Leca9, D. Margarone10, J. Metzkes1, K. Nagai17, W. Nazarov26, P. Lutoslawski10, D. Papp18, M. Passoni19、20, A. Pelka1, J. P. Perin21, J. Schulz16, M. Smid10, C. Spindloe22、23, S. Steinke24, R. Torchio3, C. Vass18, T. Wiste10, R. Zaffino25, K. Zeil1, T. Tschentscher16, U. Schramm1、13, and T. E. Cowan1、13
Author Affiliations
  • 1Institute of Radiation Physics, Helmholtz–Zentrum Dresden–Rossendorf, Germany
  • 2LULI – CNRS, Ecole Polytechnique, CEA : Université Paris-Saclay; UPMC Univ. Paris 06 - Sorbonne Universités – F-91128 Palaiseau cedex, France
  • 3European Synchrotron Radiation Facility, France
  • 4Ohio State University, USA
  • 5University of Pennsylvania, USA
  • 6Inertial Fusion Technologies, General Atomics, USA
  • 7Peter Grünberg Institute PGI-6, Forschungzentrum Jülich, Germany
  • 8Heinrich-Heine-University Düsseldorf, Germany
  • 9Horia Hulubei National Institute for R&D in Physics and Nuclear Engineering (IFIN-HH) – Extreme Light Infrastructure – Nuclear Physics (ELI-NP), Romania
  • 10Institute of Physics ASCR, FZU, ELI-Beamlines project, Czech Republic
  • 11Department of Macromolecular Physics, Faculty of Mathematics and Physics, Charles University in Prague, Czech Republic
  • 12Institute of Ion Beam Physics and Materials Research, Helmholtz–Zentrum Dresden–Rossendorf, Germany
  • 13Technische Universität Dresden, Germany
  • 14Institut de minéralogie, de physique des matériaux et de cosmochimie, UMR CNRS 7590, UPMC Univ. Paris 06 – Sorbonne Universités, France
  • 15Schafer Corporation, USA
  • 16European XFEL, Germany
  • 17Laboratory for Chemistry and Life Science, Institute of Innovative Research (IIR), Tokyo Institute of Technology, Japan
  • 18ELI-ALPS, ELI-HU Non-Profit Ltd., Hungary
  • 19Department of Energy, Politecnico di Milano, Italy
  • 20INFN-Sezione di Milano, Italy
  • 21CEA Grenoble, INAC, Service des Basses Temperatures, France
  • 22Science and Technology Facilities Council, Rutherford Appleton Laboratory, UK
  • 23Scitech Precision Ltd, Rutherford Appleton Laboratory, UK
  • 24Lawrence Berkeley National Laboratory, USA
  • 25Institute of Microelectronics of Barcelona, National Center of Microelectronic, Spanish Research Council, Spain
  • 26University of St. Andrews, UK
  • show less
    DOI: 10.1017/hpl.2017.18 Cite this Article Set citation alerts
    I. Prencipe, J. Fuchs, S. Pascarelli, D. W. Schumacher, R. B. Stephens, N. B. Alexander, R. Briggs, M. Büscher, M. O. Cernaianu, A. Choukourov, M. De Marco, A. Erbe, J. Fassbender, G. Fiquet, P. Fitzsimmons, C. Gheorghiu, J. Hund, L. G. Huang, M. Harmand, N. J. Hartley, A. Irman, T. Kluge, Z. Konopkova, S. Kraft, D. Kraus, V. Leca, D. Margarone, J. Metzkes, K. Nagai, W. Nazarov, P. Lutoslawski, D. Papp, M. Passoni, A. Pelka, J. P. Perin, J. Schulz, M. Smid, C. Spindloe, S. Steinke, R. Torchio, C. Vass, T. Wiste, R. Zaffino, K. Zeil, T. Tschentscher, U. Schramm, T. E. Cowan. Targets for high repetition rate laser facilities: needs, challenges and perspectives[J]. High Power Laser Science and Engineering, 2017, 5(3): 03000e17 Copy Citation Text show less
    Schematic view of the experimental setup used at the MEC endstation of the LCLS to study dynamic compression of graphite samples to pressures between 20 and 230 GPa. The VISAR system recorded the shock transit time providing information on the shock velocity. The microscopic state was probed by XRD. Image reproduced from Ref. [10], licensed under CC-BY 4.0[19].
    Fig. 1. Schematic view of the experimental setup used at the MEC endstation of the LCLS to study dynamic compression of graphite samples to pressures between 20 and 230 GPa. The VISAR system recorded the shock transit time providing information on the shock velocity. The microscopic state was probed by XRD. Image reproduced from Ref. [10], licensed under CC-BY 4.0[19].
    Examples of typical multilayer targets used for dynamic compression physics experiments: (a) in the simplest configuration the sample is coated with a low-Z layer (ablator), and occasionally with a preheat layer; (b) placing the sample layer between solid plates prevents expansion and maintains high-pressure conditions longer; (c) complex sample allows measurement of shock pressure by VISAR reflection from pressure standard (quartz) while also containing the sample.
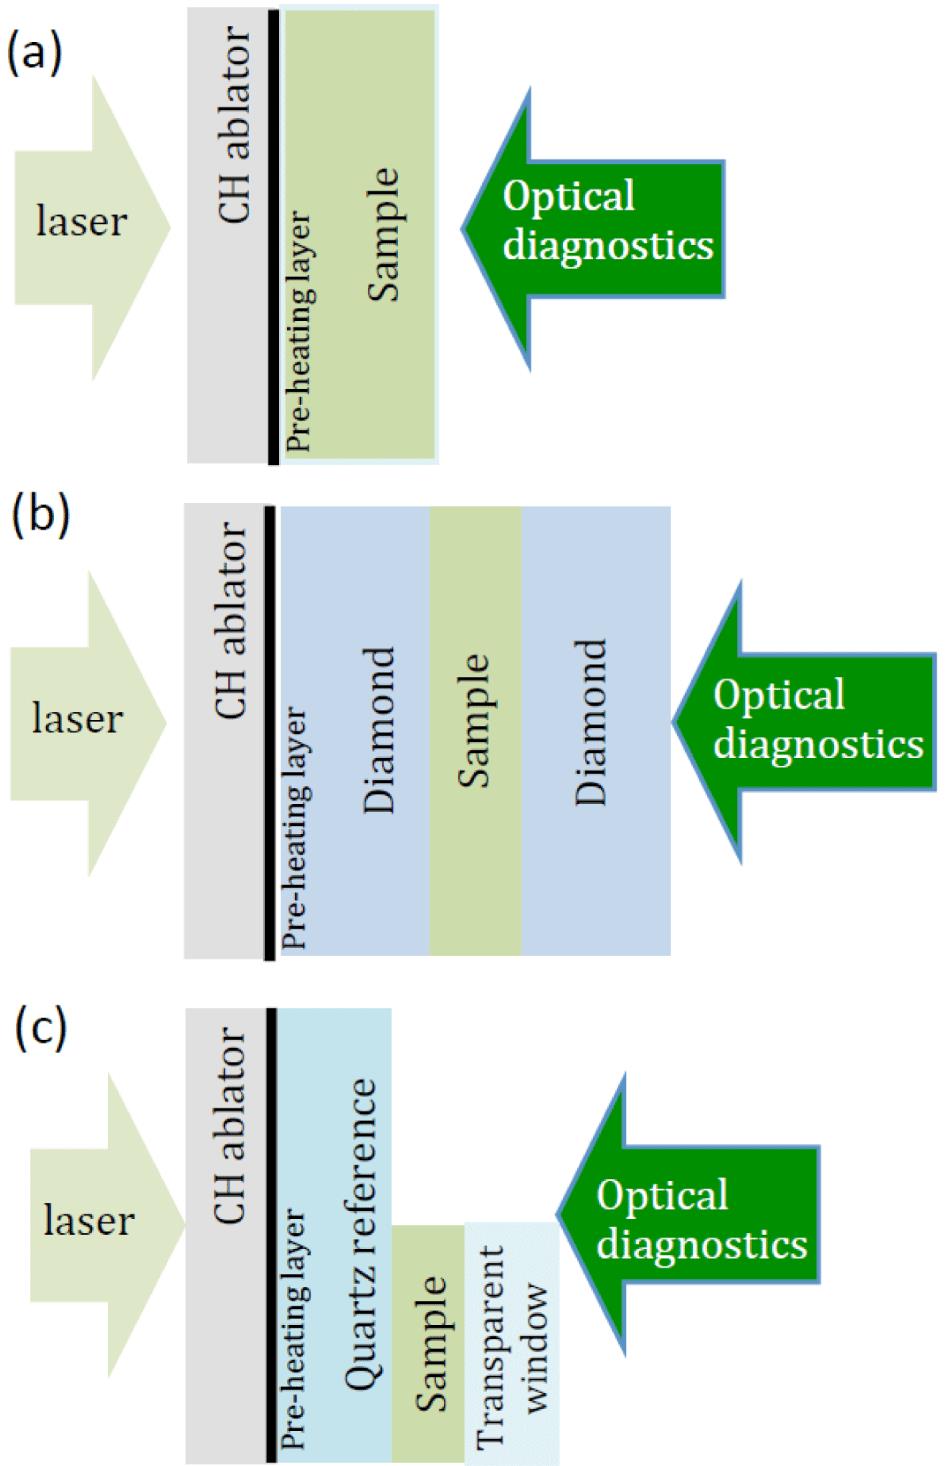
    Fig. 2. Examples of typical multilayer targets used for dynamic compression physics experiments: (a) in the simplest configuration the sample is coated with a low-Z layer (ablator), and occasionally with a preheat layer; (b) placing the sample layer between solid plates prevents expansion and maintains high-pressure conditions longer; (c) complex sample allows measurement of shock pressure by VISAR reflection from pressure standard (quartz) while also containing the sample.
    Scheme of iron–nickel alloy samples produced for ESRF experiments using an integrated process including four steps performed by different companies.
    Fig. 3. Scheme of iron–nickel alloy samples produced for ESRF experiments using an integrated process including four steps performed by different companies.
    Schematic layout of the experimental configuration used to investigate proton-driven isochoric heating of polycrystalline graphite rods $(125~\unicode[STIX]{x03BC}\text{m}\times 300~\unicode[STIX]{x03BC}\text{m}\times 3~\text{mm})$. Reprinted figure with permission from Ref. [32]. Copyright 2010 by the American Physical Society.
    Fig. 4. Schematic layout of the experimental configuration used to investigate proton-driven isochoric heating of polycrystalline graphite rods $(125~\unicode[STIX]{x03BC}\text{m}\times 300~\unicode[STIX]{x03BC}\text{m}\times 3~\text{mm})$. Reprinted figure with permission from Ref. [32]. Copyright 2010 by the American Physical Society.
    Qualitative spatial distributions of electric field (left) and electron energy density (right) produced by the interaction of an ultra-intense laser pulse with a flat-top cone target. From T. Kluge.
    Fig. 5. Qualitative spatial distributions of electric field (left) and electron energy density (right) produced by the interaction of an ultra-intense laser pulse with a flat-top cone target. From T. Kluge.
    (a) Hollow cone target with thin wire at the tip (diameter $5~\unicode[STIX]{x03BC}\text{m}$, length 1 mm): the black line shows a wire aligned along the cone axis, the dashed line represents a wire tilted by $15^{\circ }$ from the cone axis (size bar is $300~\unicode[STIX]{x03BC}\text{m}$). Spatial distribution of electrons with energy above 3.5 MeV for a wire positioned along (b) the cone axis and (c) tilted by $15^{\circ }$. Reprinted with permission from Macmillian Publishers Ltd: Nature[35], copyright 2004.
    Fig. 6. (a) Hollow cone target with thin wire at the tip (diameter $5~\unicode[STIX]{x03BC}\text{m}$, length 1 mm): the black line shows a wire aligned along the cone axis, the dashed line represents a wire tilted by $15^{\circ }$ from the cone axis (size bar is $300~\unicode[STIX]{x03BC}\text{m}$). Spatial distribution of electrons with energy above 3.5 MeV for a wire positioned along (b) the cone axis and (c) tilted by $15^{\circ }$. Reprinted with permission from Macmillian Publishers Ltd: Nature[35], copyright 2004.
    2D spatial distribution of free electron density and longitudinal electrostatic field at 43 fs prior to the peak laser intensity on the target. The density distribution shows that internal expansions compress the CD$_{2}$ layer to a higher density with a factor of about 1.5. The compression is also associated with enhanced ion heating in the compression layers. Strong ripples and filaments are clearly seen in the front surface and bulk of the buried layer target. The detailed simulation parameters and physics can be found in Huang et al.[38]. From L. G. Huang.
    Fig. 7. 2D spatial distribution of free electron density and longitudinal electrostatic field at 43 fs prior to the peak laser intensity on the target. The density distribution shows that internal expansions compress the CD$_{2}$ layer to a higher density with a factor of about 1.5. The compression is also associated with enhanced ion heating in the compression layers. Strong ripples and filaments are clearly seen in the front surface and bulk of the buried layer target. The detailed simulation parameters and physics can be found in Huang et al.[38]. From L. G. Huang.
    Simulated energy density distribution showing the growth of seeded Rayleigh–Taylor instabilities in samples with an initial surface roughness containing several spatial frequencies. For each image, the black bar illustrates the maximum spatial frequency of the initial roughness, the minimum spatial frequency is twice this size. Reproduced from Ref. [40], with the permission of AIP publishing.
    Fig. 8. Simulated energy density distribution showing the growth of seeded Rayleigh–Taylor instabilities in samples with an initial surface roughness containing several spatial frequencies. For each image, the black bar illustrates the maximum spatial frequency of the initial roughness, the minimum spatial frequency is twice this size. Reproduced from Ref. [40], with the permission of AIP publishing.
    Scanning electron microscopy (SEM) micrograph of a grating with period around $1~\unicode[STIX]{x03BC}\text{m}$. Courtesy of T. Schoenherr, Y. Georgiev and A. Erbe, Institute of Ion Beam Physics and Materials Research, HZDR.
    Fig. 9. Scanning electron microscopy (SEM) micrograph of a grating with period around $1~\unicode[STIX]{x03BC}\text{m}$. Courtesy of T. Schoenherr, Y. Georgiev and A. Erbe, Institute of Ion Beam Physics and Materials Research, HZDR.
    Schematic illustration of the production of X-rays in the interaction between a laser pulse and a gas target. The betatron motion of electrons propagating in the pulse wake results in the emission of synchrotron radiation.
    Fig. 10. Schematic illustration of the production of X-rays in the interaction between a laser pulse and a gas target. The betatron motion of electrons propagating in the pulse wake results in the emission of synchrotron radiation.
    Adjustable length gas cell developed by SourceLAB. Courtesy of F. Sylla.
    Fig. 11. Adjustable length gas cell developed by SourceLAB. Courtesy of F. Sylla.
    Cross-section and assembly of fast electro-valve and nozzle for sub-millimetre He gas jets with peak density above $10^{22}~\text{atoms}~\text{cm}^{-3}$. The nozzle throat diameter is smaller than $400~\unicode[STIX]{x03BC}\text{m}$ and He pressure ranges between 300 and 400 bar. Reprinted from Ref. [55], with the permission of AIP Publishing.
    Fig. 12. Cross-section and assembly of fast electro-valve and nozzle for sub-millimetre He gas jets with peak density above $10^{22}~\text{atoms}~\text{cm}^{-3}$. The nozzle throat diameter is smaller than $400~\unicode[STIX]{x03BC}\text{m}$ and He pressure ranges between 300 and 400 bar. Reprinted from Ref. [55], with the permission of AIP Publishing.
    Schematic illustration of TNSA – relativistic electrons produced in laser–matter interaction propagate through the target and form an electron sheath at the target rear surface producing a charge separation and intense electric fields.
    Fig. 13. Schematic illustration of TNSA – relativistic electrons produced in laser–matter interaction propagate through the target and form an electron sheath at the target rear surface producing a charge separation and intense electric fields.
    Schematic illustration of laser-driven ion acceleration from a metallic foil with a hydrogen-rich micro-dot on the back side. Reprinted with permission from Macmillan Publishers Ltd: Nature[77], copyright 2006.
    Fig. 14. Schematic illustration of laser-driven ion acceleration from a metallic foil with a hydrogen-rich micro-dot on the back side. Reprinted with permission from Macmillan Publishers Ltd: Nature[77], copyright 2006.
    SEM microscope images of a single layer of polystyrene spheres (a) with diameter $0.9~\unicode[STIX]{x03BC}\text{m}$ and regularly arranged (hexagonal pattern); (b) with diameter $0.26~\unicode[STIX]{x03BC}\text{m}$ (irregular pattern due to substrate cutting process). (c) Atomic force microscopy (AFM) characterization of a commercially available foil (Al $2~\unicode[STIX]{x03BC}\text{m}$, Goodfellow). Image reproduced from Ref. [79], licensed under CC-BY-NC-SA 3.0[80].
    Fig. 15. SEM microscope images of a single layer of polystyrene spheres (a) with diameter $0.9~\unicode[STIX]{x03BC}\text{m}$ and regularly arranged (hexagonal pattern); (b) with diameter $0.26~\unicode[STIX]{x03BC}\text{m}$ (irregular pattern due to substrate cutting process). (c) Atomic force microscopy (AFM) characterization of a commercially available foil (Al $2~\unicode[STIX]{x03BC}\text{m}$, Goodfellow). Image reproduced from Ref. [79], licensed under CC-BY-NC-SA 3.0[80].
    SEM micrographs of carbon foams produced by PLD with Ar as buffer gas and different target to substrate distance, gas pressure, process duration: (a) 4.5 cm, 500 Pa, 3 min; (b) 8.5 cm, 100 Pa, 10 min. Image reproduced from Ref. [83], licensed under CC-BY 3.0[84].
    Fig. 16. SEM micrographs of carbon foams produced by PLD with Ar as buffer gas and different target to substrate distance, gas pressure, process duration: (a) 4.5 cm, 500 Pa, 3 min; (b) 8.5 cm, 100 Pa, 10 min. Image reproduced from Ref. [83], licensed under CC-BY 3.0[84].
    (a) Schematic view of a flat target grounded through a coil. The return current flowing in the coil produces electric fields allowing for energy selection, collimation and post-acceleration of laser-driven ions: (b) shows a scheme of the electric field configuration in the coil (snapshot), (c) and (d) illustrate the electric field profiles inside the coil along the coil axis and in the transverse plane at the location of the peak of charge density along the coil. Image reproduced from Ref. [94], licensed under CC-BY 4.0[19].
    Fig. 17. (a) Schematic view of a flat target grounded through a coil. The return current flowing in the coil produces electric fields allowing for energy selection, collimation and post-acceleration of laser-driven ions: (b) shows a scheme of the electric field configuration in the coil (snapshot), (c) and (d) illustrate the electric field profiles inside the coil along the coil axis and in the transverse plane at the location of the peak of charge density along the coil. Image reproduced from Ref. [94], licensed under CC-BY 4.0[19].
    SEM micrographs of poly(4-methyl-1-pentene) foams prepared from (a), (b) 1-hexanol, (c) 2-methyl-1-pentanol, (d) 2-ethyl-1-butanol. Image reproduced from Ref. [109]. Copyright 2002 The Japan Society of Applied Physics.
    Fig. 18. SEM micrographs of poly(4-methyl-1-pentene) foams prepared from (a), (b) 1-hexanol, (c) 2-methyl-1-pentanol, (d) 2-ethyl-1-butanol. Image reproduced from Ref. [109]. Copyright 2002 The Japan Society of Applied Physics.
    (a) LSTI: wiper and frame with a 4 mm aperture. (b) Liquid crystal targets with four different thicknesses. Thickness is a function of the blade sliding velocity. (c) Film production process: the blade slides across the aperture drawing the liquid. The film is formed within $2~\unicode[STIX]{x03BC}\text{m}$ of the same location each time due to the aperture $45^{\circ }$ inner bevel. Reprinted from Ref. [70], with the permission of AIP Publishing.
    Fig. 19. (a) LSTI: wiper and frame with a 4 mm aperture. (b) Liquid crystal targets with four different thicknesses. Thickness is a function of the blade sliding velocity. (c) Film production process: the blade slides across the aperture drawing the liquid. The film is formed within $2~\unicode[STIX]{x03BC}\text{m}$ of the same location each time due to the aperture $45^{\circ }$ inner bevel. Reprinted from Ref. [70], with the permission of AIP Publishing.
    Target fabrication and delivery process: flow chart. From N. Alexander (GA-IFT).
    Fig. 20. Target fabrication and delivery process: flow chart. From N. Alexander (GA-IFT).
    SEM micrographs characterizing the surface quality of planar targets. (a) Al film deposited on Si wafer by magnetron sputtering. The inset shows a cross-section of the same film. Roughness measured by AFM is around 10 nm. (b) Commercial Ti foil (thickness $5~\unicode[STIX]{x03BC}\text{m}$). The inset shows a detail of the surface. Institute of Ion Beam Physics and Materials Research, HZDR.
    Fig. 21. SEM micrographs characterizing the surface quality of planar targets. (a) Al film deposited on Si wafer by magnetron sputtering. The inset shows a cross-section of the same film. Roughness measured by AFM is around 10 nm. (b) Commercial Ti foil (thickness $5~\unicode[STIX]{x03BC}\text{m}$). The inset shows a detail of the surface. Institute of Ion Beam Physics and Materials Research, HZDR.
    Computer vision and force sensing have been added to the fixture-based robotic planar target assembly station. Unpublished from N. Alexander and P. Fitzsimmons (GA-ICF).
    Fig. 22. Computer vision and force sensing have been added to the fixture-based robotic planar target assembly station. Unpublished from N. Alexander and P. Fitzsimmons (GA-ICF).
    Target damage observed for a sheet of Ti $2~\unicode[STIX]{x03BC}\text{m}$ thick with carbon foam coating: (a) target sheet clamped between two identical protective grids before the experiment, (b) damage observed in the target sheet while dismantling the target after the experiment.
    Fig. 23. Target damage observed for a sheet of Ti $2~\unicode[STIX]{x03BC}\text{m}$ thick with carbon foam coating: (a) target sheet clamped between two identical protective grids before the experiment, (b) damage observed in the target sheet while dismantling the target after the experiment.
    Targets mounted on thin foils. (a) $250~\unicode[STIX]{x03BC}\text{m}$ diameter, $80~\unicode[STIX]{x03BC}\text{m}$ thick aluminium disk glued to 30 nm CH foil; (b) WYKO plot of $50~\unicode[STIX]{x03BC}\text{m}$ diameter, $1.3~\unicode[STIX]{x03BC}\text{m}$ copper disk deposited on 30 nm CH film, from R. B. Stephens and N. Alexander (GA-IFT).
    Fig. 24. Targets mounted on thin foils. (a) $250~\unicode[STIX]{x03BC}\text{m}$ diameter, $80~\unicode[STIX]{x03BC}\text{m}$ thick aluminium disk glued to 30 nm CH foil; (b) WYKO plot of $50~\unicode[STIX]{x03BC}\text{m}$ diameter, $1.3~\unicode[STIX]{x03BC}\text{m}$ copper disk deposited on 30 nm CH film, from R. B. Stephens and N. Alexander (GA-IFT).
    Fast target positioning system developed for the ELIMAIA interaction area, ELI-Beams. From T. Wiste.
    Fig. 25. Fast target positioning system developed for the ELIMAIA interaction area, ELI-Beams. From T. Wiste.
    Concept model of a ladder positioning system, composed of: a ladder supply cassette loaded with new targets; a motorized arm to pull out ladders from the cassette; precision motors to place the target at laser focus; a drop-off cassette receiving used ladders. From N. Alexander (GA-IFT).
    Fig. 26. Concept model of a ladder positioning system, composed of: a ladder supply cassette loaded with new targets; a motorized arm to pull out ladders from the cassette; precision motors to place the target at laser focus; a drop-off cassette receiving used ladders. From N. Alexander (GA-IFT).
    Target fielding system concept, utilizing mechanism of cinema film projector, mounts targets on carbon fibres over holes in linked belts or continuous steel film strips (not shown). Target quantities in excess of $10^{4}$ can be placed on manageable sized reels. From N. Alexander (GA-IFT).
    Fig. 27. Target fielding system concept, utilizing mechanism of cinema film projector, mounts targets on carbon fibres over holes in linked belts or continuous steel film strips (not shown). Target quantities in excess of $10^{4}$ can be placed on manageable sized reels. From N. Alexander (GA-IFT).
    I. Prencipe, J. Fuchs, S. Pascarelli, D. W. Schumacher, R. B. Stephens, N. B. Alexander, R. Briggs, M. Büscher, M. O. Cernaianu, A. Choukourov, M. De Marco, A. Erbe, J. Fassbender, G. Fiquet, P. Fitzsimmons, C. Gheorghiu, J. Hund, L. G. Huang, M. Harmand, N. J. Hartley, A. Irman, T. Kluge, Z. Konopkova, S. Kraft, D. Kraus, V. Leca, D. Margarone, J. Metzkes, K. Nagai, W. Nazarov, P. Lutoslawski, D. Papp, M. Passoni, A. Pelka, J. P. Perin, J. Schulz, M. Smid, C. Spindloe, S. Steinke, R. Torchio, C. Vass, T. Wiste, R. Zaffino, K. Zeil, T. Tschentscher, U. Schramm, T. E. Cowan. Targets for high repetition rate laser facilities: needs, challenges and perspectives[J]. High Power Laser Science and Engineering, 2017, 5(3): 03000e17
    Download Citation