• Acta Optica Sinica
  • Vol. 40, Issue 18, 1812001 (2020)
Wenhai Ji, Di Song, Yue Jiao, Longyan Ma, and Guolin Li*
Author Affiliations
  • College of Control Science and Engineering, China University of Petroleum (East China), Qingdao, Shandong 266580, China
  • show less
    DOI: 10.3788/AOS202040.1812001 Cite this Article Set citation alerts
    Wenhai Ji, Di Song, Yue Jiao, Longyan Ma, Guolin Li. Methane Telemetry Based on Optical Path Automatic Collimation[J]. Acta Optica Sinica, 2020, 40(18): 1812001 Copy Citation Text show less
    Diagram of telemetry device
    Fig. 1. Diagram of telemetry device
    Optical power (DC) signal and spectrum (2f) signal of detection device
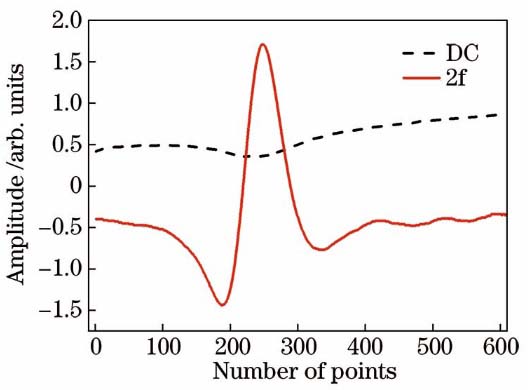
    Fig. 2. Optical power (DC) signal and spectrum (2f) signal of detection device
    Laser beam divergence angle under different driving currents. (a) In W direction; (b) in V direction
    Fig. 3. Laser beam divergence angle under different driving currents. (a) In W direction; (b) in V direction
    Changes in the received optical power
    Fig. 4. Changes in the received optical power
    Variation of spot center position. (a) At 44 cm; (b) at 167 cm
    Fig. 5. Variation of spot center position. (a) At 44 cm; (b) at 167 cm
    Zoom lens in ZEMAX simulation. (a) Structure of zoom lens; (b) deformation model of zoom lens surface affected by gravity
    Fig. 6. Zoom lens in ZEMAX simulation. (a) Structure of zoom lens; (b) deformation model of zoom lens surface affected by gravity
    Concentration calibration. (a) 2f spectra of methane at different concentrations; (b) relationship between peak-peak value of 2f signal and integral concentration
    Fig. 7. Concentration calibration. (a) 2f spectra of methane at different concentrations; (b) relationship between peak-peak value of 2f signal and integral concentration
    Stability test. (a) CH4 concentration reading; (b) Allan variance curve
    Fig. 8. Stability test. (a) CH4 concentration reading; (b) Allan variance curve
    Telemetry device and results. (a) Test for methane leaking in corridor; (b) optical devices of telemetry device; (c) test spectrum for methane concentration of 4.95×10⁻⁶
    Fig. 9. Telemetry device and results. (a) Test for methane leaking in corridor; (b) optical devices of telemetry device; (c) test spectrum for methane concentration of 4.95×10⁻⁶
    Test distance /mConcentration ofsample /%Optimal drivingcurrent /mAIncreased timesof receiving optical powerImprovementtimes of SNR
    0.1251.71.69
    4.50.5253.61.24
    1.0102.41.10
    0.185--892.81.28
    500.586--892.01.36
    1.091--952.01.09
    Table 1. Improvement effect of electronically controlled zoom lens on receiving optical power
    Current /mAFocallength /cmMeasuredangle /(°)Spherical modelAspherical model
    Simulationangle /(°)Error /(°)Simulationangle /(°)Error /(°)
    85374.50.013690.01300-0.000690.01357-0.00012
    92220.8-0.00835-0.007380.00097-0.00842-0.00007
    95187.6-0.02282-0.02572-0.00290-0.02297-0.00015
    Table 2. Measured and simulated values of deflection angle for different focal lengths of different models
    Test No.Test distance /mIntegral concentration /10-6Average concentration /10-6
    1100.0740.07.40
    2104.4516.94.95
    Table 3. Field test results
    Wenhai Ji, Di Song, Yue Jiao, Longyan Ma, Guolin Li. Methane Telemetry Based on Optical Path Automatic Collimation[J]. Acta Optica Sinica, 2020, 40(18): 1812001
    Download Citation