
Cancan Zeng, Mingjun Ren, Gaobo Xiao, Yuehong Yin. Multi-Scale Stereo Matching Based on Bayesian Reasoning[J]. Acta Optica Sinica, 2017, 37(12): 1215004
- Acta Optica Sinica
- Vol. 37, Issue 12, 1215004 (2017)
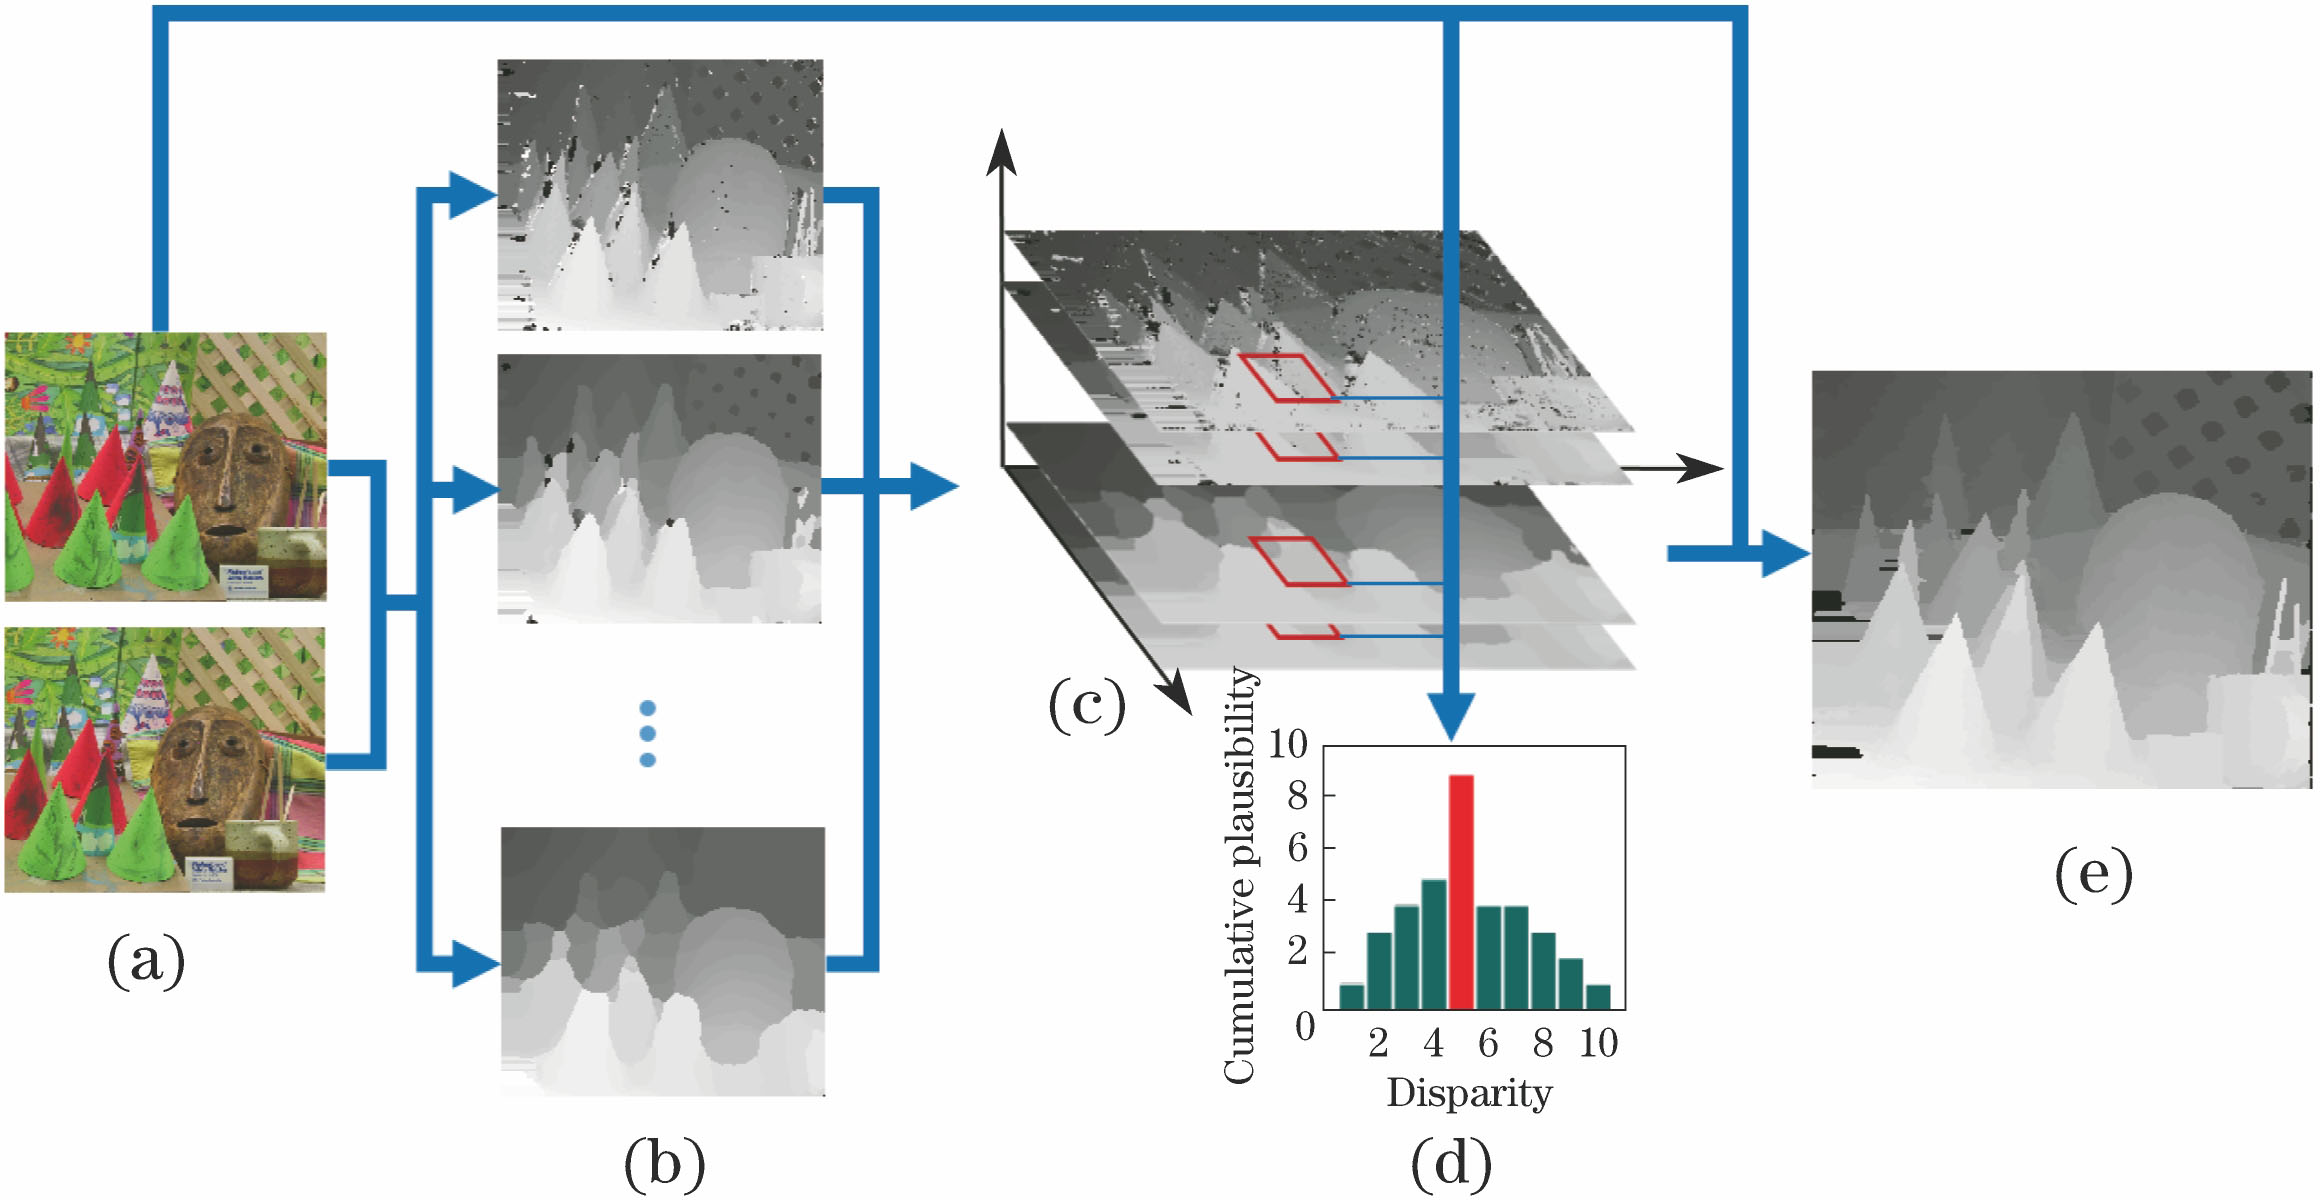
Fig. 1. Flow chart of multi-scale optimization algorithm. (a) Left and right images of binocular vision; (b) disparity maps with scale information; (c) disparity space constructed by disparity maps; (d) histogram of cumulative plausibility of one pixel; (e) final optimization results
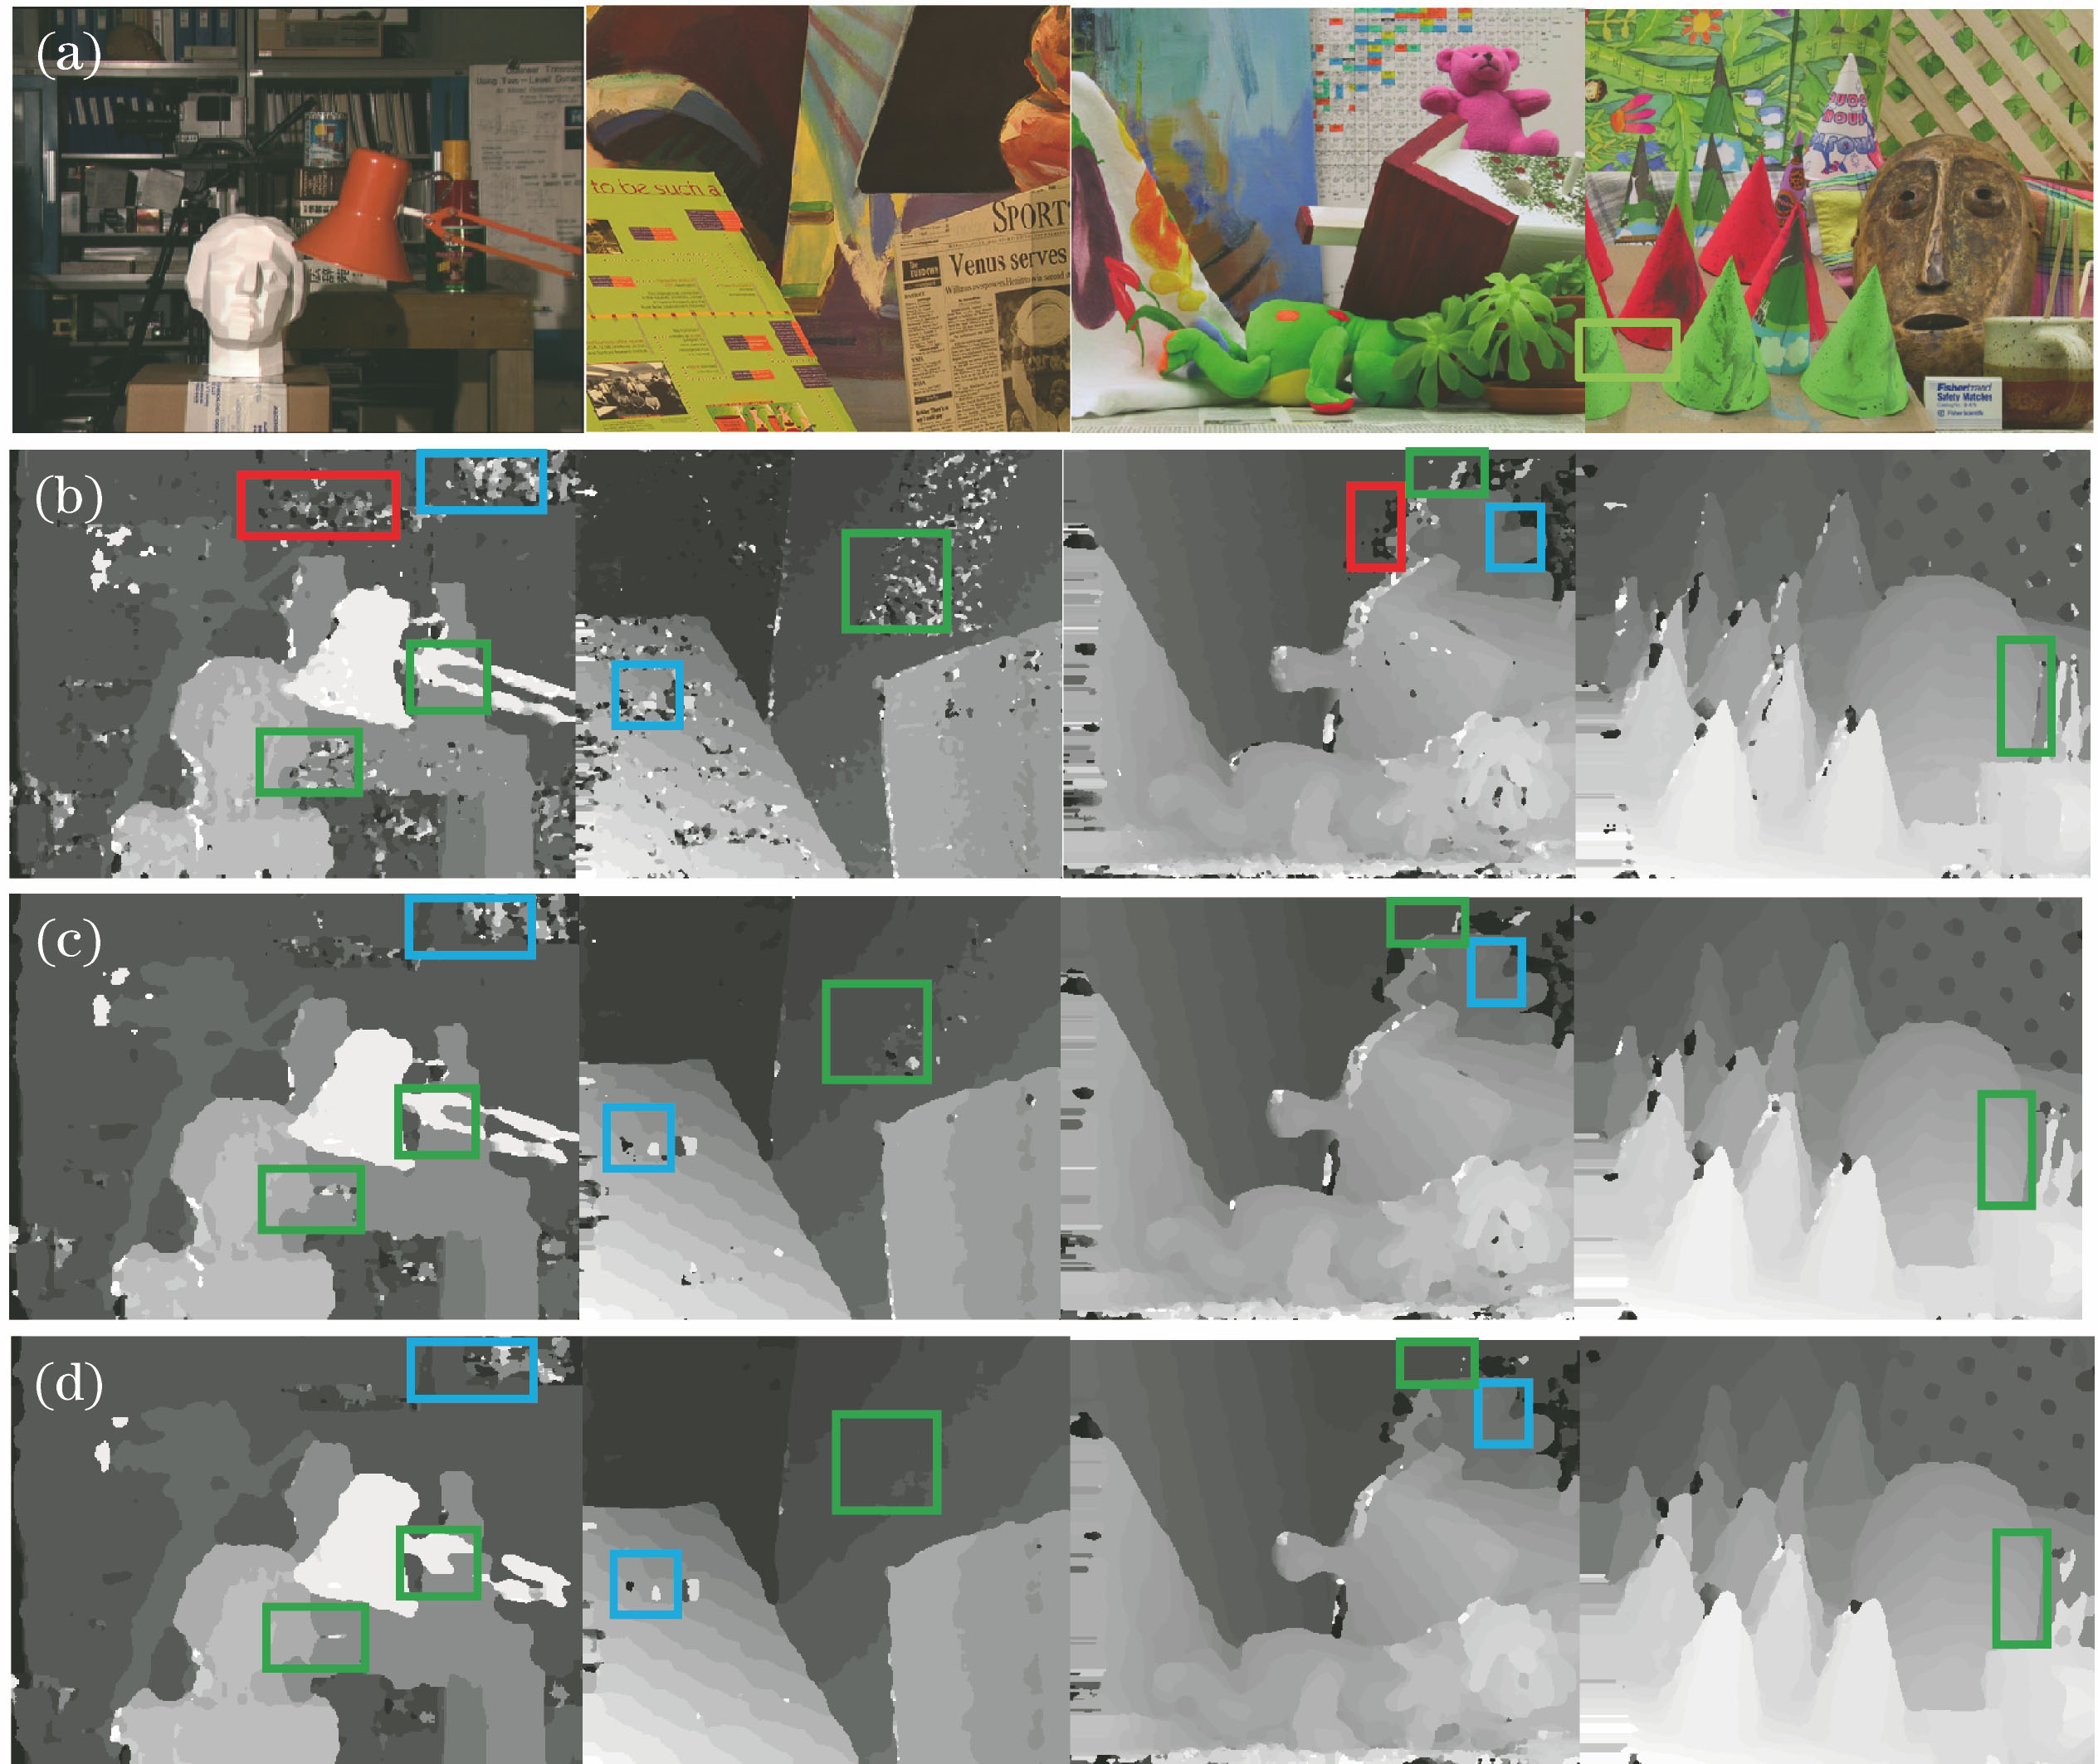
Fig. 2. (a) Reference images; disparity maps with different window sizes: (b) window diameter is 1/100 image width; (c) window diameter is 1/50 image width; (d) window diameter is 1/30 image width
Fig. 3. Comparison of experimental results. (a) Ground truth maps; (b) RealTime BP algorithm; (c) FastBilateral algorithm; (d) MSO algorithm; (e)-(g) corresponding mismatched regions
| ||||||||||||||||||||||||||||||||||||||||||||||||||||||||||||||||||||||||||||||||||||||||||||||||||||||||||||||||||||||||||||||||||||||
Table 1. Performance comparison of proposed algorithm with other real-time algorithms
| ||||||||||||||||||||||||||||||||||||||||||||||||||||||||||||||||||
Table 2. Performance comparison of proposed algorithm by using BM algorithm and GF algorithm to create disparity space
|
Table 3. Comparison of speed performance of proposed algorithm and other real-time algorithms

Set citation alerts for the article
Please enter your email address
© Copyright 2018-2021 | Chinese Laser Press. All Rights Reserved 沪ICP备15018463号-20