
Meng-qing QIU, Qing-shan XU, Shou-guo ZHENG, Shi-zhuang WENG. Research Progress of Surface-Enhanced Raman Spectroscopy in Pesticide Residue Detection[J]. Spectroscopy and Spectral Analysis, 2021, 41(11): 3339
- Spectroscopy and Spectral Analysis
- Vol. 41, Issue 11, 3339 (2021)
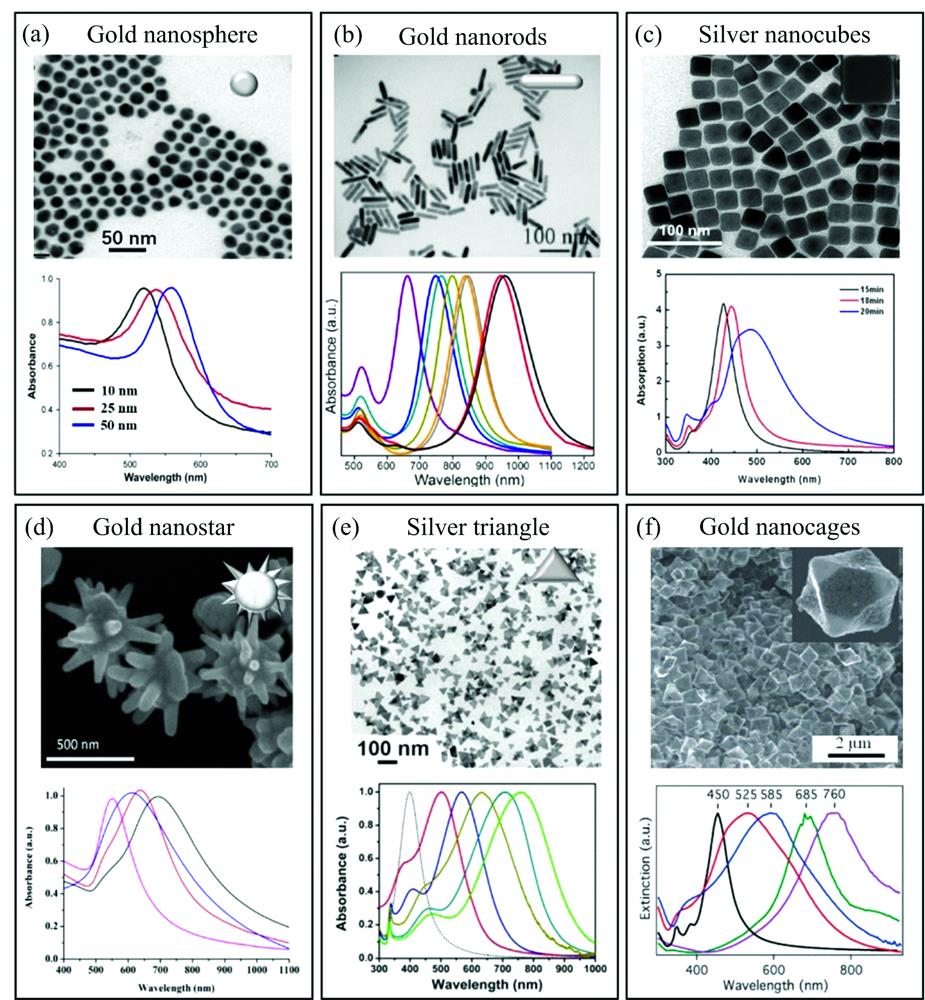
Fig. 1. TEM image and absorption spectrum of nanocolloids of different sizes or shapes
(a): Gold nanospheres; (b): Gold nanorods; (c): Silver nanocubes;(d): Gold nanostar; (e): Silver triangle; (f): Gold nanocages
(a): Gold nanospheres; (b): Gold nanorods; (c): Silver nanocubes;(d): Gold nanostar; (e): Silver triangle; (f): Gold nanocages
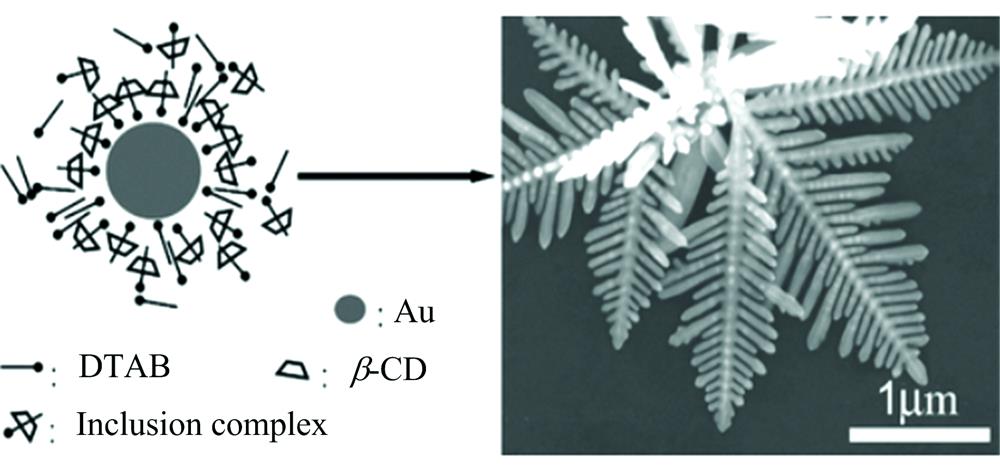
Fig. 2. Synthesis of gold nanocrystals
Fig. 3. (a) Raman spectra on fresh citrus fruits. Curve Ⅰ, clean peel; curve Ⅱ, contaminated with methyl parathion; Curve Ⅲ, contaminated orange surface modified by Au/SiO2 nanoparticles; Curve Ⅳ, methyl parathionpowder; (b) Schematic of the SHINERS experiment
Fig. 4. Silver particles coated with polyethylene microspheres modified cysteamine or mercaptopropionic acid for detection of pesticides with different charges in seawater
Fig. 5. Diagram of the device for in-fiber optofluidic SERS detection. Inset: end-face of the MHF without modifying Ag NPs
Fig. 6. Schematic diagram of detection of acephate in rice using by D-SERS and AuNRs-cys combined with multivariant methods
Fig. 7. Scatter plot of first two principle component score obtained by KPCA with σ of 1 000 (a), 5 000 (b), 8 000 (c) and 10 000 (d)
PC1: The first principle component; PC2: The second principle component
PC1: The first principle component; PC2: The second principle component
Fig. 8. Predicted error of the optimal model built using SVR and KPCA with σ of 8 000
| ||||||||||||||||||||
Table 1. Predicted results of the model developed using chemometric methods

Set citation alerts for the article
Please enter your email address
© Copyright 2018-2021 | Chinese Laser Press. All Rights Reserved 沪ICP备15018463号-20