• Journal of Semiconductors
  • Vol. 45, Issue 3, 032702 (2024)
Tingting Shi1、2、3, Yuanbin Fan1, Zhengyu Yan1, Lai Zhou1, Yang Ji2、3, and Zhiliang Yuan1、*
Author Affiliations
  • 1Beijing Academy of Quantum Information Sciences, Beijing 100193, China
  • 2Institute of Semiconductors, Chinese Academy of Sciences, Beijing 100083, China
  • 3College of Materials Science and Opto-Electronic Technology, University of Chinese Academy of Sciences, Beijing 100049, China
  • show less
    DOI: 10.1088/1674-4926/45/3/032702 Cite this Article
    Tingting Shi, Yuanbin Fan, Zhengyu Yan, Lai Zhou, Yang Ji, Zhiliang Yuan. GHz photon-number resolving detection with high detection efficiency and low noise by ultra-narrowband interference circuits[J]. Journal of Semiconductors, 2024, 45(3): 032702 Copy Citation Text show less
    (Color online) The photon-number resolving detection setup. (a) SG: signal generator; VOA: variable optical attenuator; APD: single-photon avalanche diodes based on InGaAs/InP; UNIC: ultra-narrowband interference circuits; BSF: band stop filter with a cut-off frequency of 2.5 GHz; APM: amplifier; OSC: oscilloscope; TDC: time-digital-converter. (b) Ultranarrow interference circuit (UNIC) consists of two couplers (CPL) with a power splitting ratio of 9 : 1, a π-resistance attenuator (ATT) and a surface acoustic wave band pass filter (SAW). (c) Transmission spectrum of raw out and BSF out.
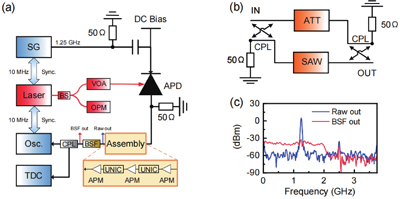
    Fig. 1. (Color online) The photon-number resolving detection setup. (a) SG: signal generator; VOA: variable optical attenuator; APD: single-photon avalanche diodes based on InGaAs/InP; UNIC: ultra-narrowband interference circuits; BSF: band stop filter with a cut-off frequency of 2.5 GHz; APM: amplifier; OSC: oscilloscope; TDC: time-digital-converter. (b) Ultranarrow interference circuit (UNIC) consists of two couplers (CPL) with a power splitting ratio of 9 : 1, a π-resistance attenuator (ATT) and a surface acoustic wave band pass filter (SAW). (c) Transmission spectrum of raw out and BSF out.
    (Color online) InGaAs/InP APD has intrinsic photon number resolution. (a) Temporal evolution of the avalanche peak voltage distribution for a detected flux of three photons/pulse. (b) The temporal voltage distribution at different time delays of 0.11 ns (black), 0.22 ns (green), and 0.4 ns (red), respectively.
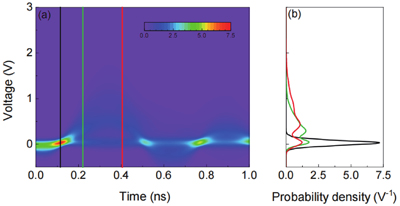
    Fig. 2. (Color online) InGaAs/InP APD has intrinsic photon number resolution. (a) Temporal evolution of the avalanche peak voltage distribution for a detected flux of three photons/pulse. (b) The temporal voltage distribution at different time delays of 0.11 ns (black), 0.22 ns (green), and 0.4 ns (red), respectively.
    (Color online) The evolution of peak output signal distribution measured for different voltage applied and incident photon fluxes on the APD. The bias voltages (detection efficiencies) of the three columns are 69.5 V (34%), 70.5 V (45%), and 71.0 V (49%), respectively. The incident photon fluxes in the three rows are 0.45, 3.55, and 7.08, respectively.
    Fig. 3. (Color online) The evolution of peak output signal distribution measured for different voltage applied and incident photon fluxes on the APD. The bias voltages (detection efficiencies) of the three columns are 69.5 V (34%), 70.5 V (45%), and 71.0 V (49%), respectively. The incident photon fluxes in the three rows are 0.45, 3.55, and 7.08, respectively.
    (Color online) The bias voltage (black, left axis) and detection efficiency (red, right axis) vs. the mean voltage of one-photon peak voltage at a fixed photon flux μ = 2.98 photons/pulse.
    Fig. 4. (Color online) The bias voltage (black, left axis) and detection efficiency (red, right axis) vs. the mean voltage of one-photon peak voltage at a fixed photon flux μ = 2.98 photons/pulse.
    (Color online) Quantitative analysis of photon number resolution for a detected flux μ = 7.08 photons/pulse. (a) Probability density distributions of avalanche peak voltages. The red solid line is a fit to the experiment data (symbols), indicating the sum of individual Gaussians (blue dashed line) of different photon numbers. (b) The mean voltage of peak output signal is proportional to the number of photons induced avalanches. (c) Comparison of the theoretical Poisson distribution (red) and the distribution of each photon number state of the APD (blue).
    Fig. 5. (Color online) Quantitative analysis of photon number resolution for a detected flux μ = 7.08 photons/pulse. (a) Probability density distributions of avalanche peak voltages. The red solid line is a fit to the experiment data (symbols), indicating the sum of individual Gaussians (blue dashed line) of different photon numbers. (b) The mean voltage of peak output signal is proportional to the number of photons induced avalanches. (c) Comparison of the theoretical Poisson distribution (red) and the distribution of each photon number state of the APD (blue).
    Tingting Shi, Yuanbin Fan, Zhengyu Yan, Lai Zhou, Yang Ji, Zhiliang Yuan. GHz photon-number resolving detection with high detection efficiency and low noise by ultra-narrowband interference circuits[J]. Journal of Semiconductors, 2024, 45(3): 032702
    Download Citation