• Photonics Research
  • Vol. 8, Issue 1, 57 (2020)
O. V. Borovkova1、*, D. O. Ignatyeva1、2, S. K. Sekatskii3, A. Karabchevsky4、5, and V. I. Belotelov1、2
Author Affiliations
  • 1Russian Quantum Center, Skolkovo, Moscow 143025, Russia
  • 2Lomonosov Moscow State University, Moscow 119991, Russia
  • 3Laboratoire de Physique de la Matière Vivante, IPHYS, EPFL, 1015 Lausanne, Switzerland
  • 4School of Electrical and Computer Engineering, Ben-Gurion University of the Negev, Beer-Sheva 8410501, Israel
  • 5e-mail: alinak@bgu.ac.il
  • show less
    DOI: 10.1364/PRJ.8.000057 Cite this Article Set citation alerts
    O. V. Borovkova, D. O. Ignatyeva, S. K. Sekatskii, A. Karabchevsky, V. I. Belotelov. High-Q surface electromagnetic wave resonance excitation in magnetophotonic crystals for supersensitive detection of weak light absorption in the near-infrared[J]. Photonics Research, 2020, 8(1): 57 Copy Citation Text show less
    Schematic representation of the proposed sensor. Incident light illuminates the prism, which in turn provides the momentum to excite the quasi-surface modes. The surface modes excite the studied organic molecular vibrations overtones in the PC-based multilayer sensor that is observed in the reflectance spectra of s-polarized light for the nonmagnetic structure and in the transverse MO Kerr effect spectra of p-polarized light for the magnetic structure.
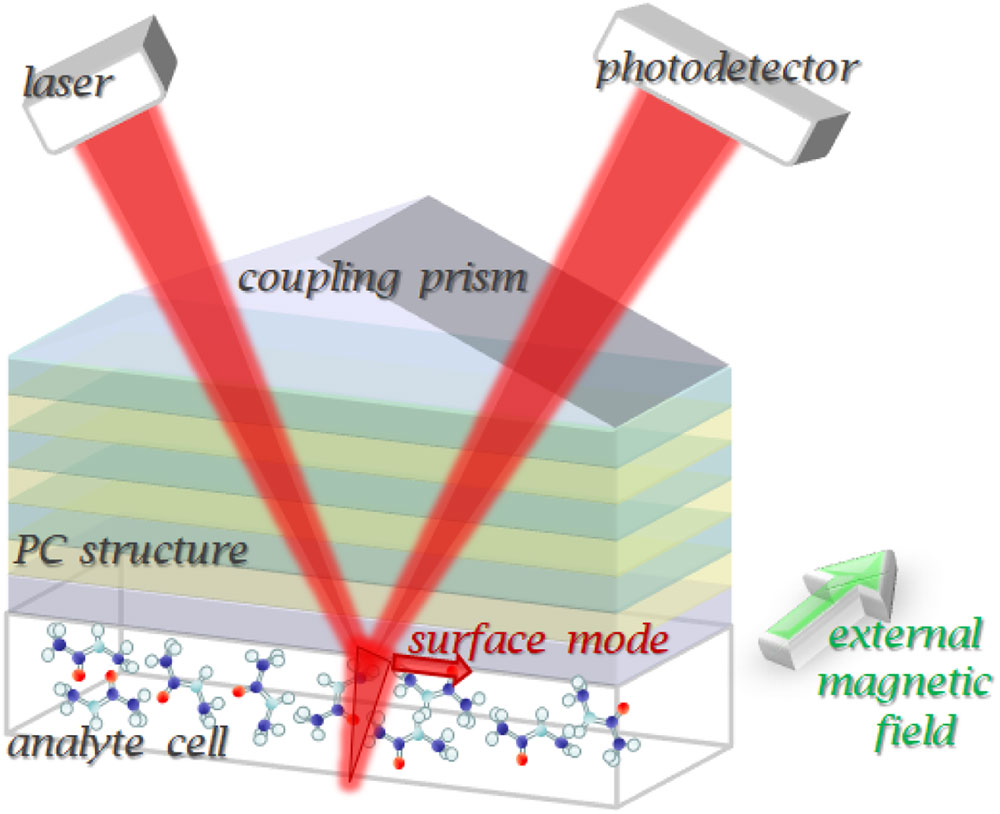
    Fig. 1. Schematic representation of the proposed sensor. Incident light illuminates the prism, which in turn provides the momentum to excite the quasi-surface modes. The surface modes excite the studied organic molecular vibrations overtones in the PC-based multilayer sensor that is observed in the reflectance spectra of s-polarized light for the nonmagnetic structure and in the transverse MO Kerr effect spectra of p-polarized light for the magnetic structure.
    (a) PC structure scheme and the electromagnetic field distribution of the mode inside the PC structure and NMA analyte. The reflectance spectrum (incidence angle versus wavelength) of the PC-based structure for superhigh Q sensing; (b) large scale, the position of the excited mode with respect to the PC BG and total internal reflection angle, shown by green rectangle; (c) magnified scale showing the ultrahigh-Q of the excited mode; (d) magnified scale showing the disappearance of the resonance in the case of zero absorption.
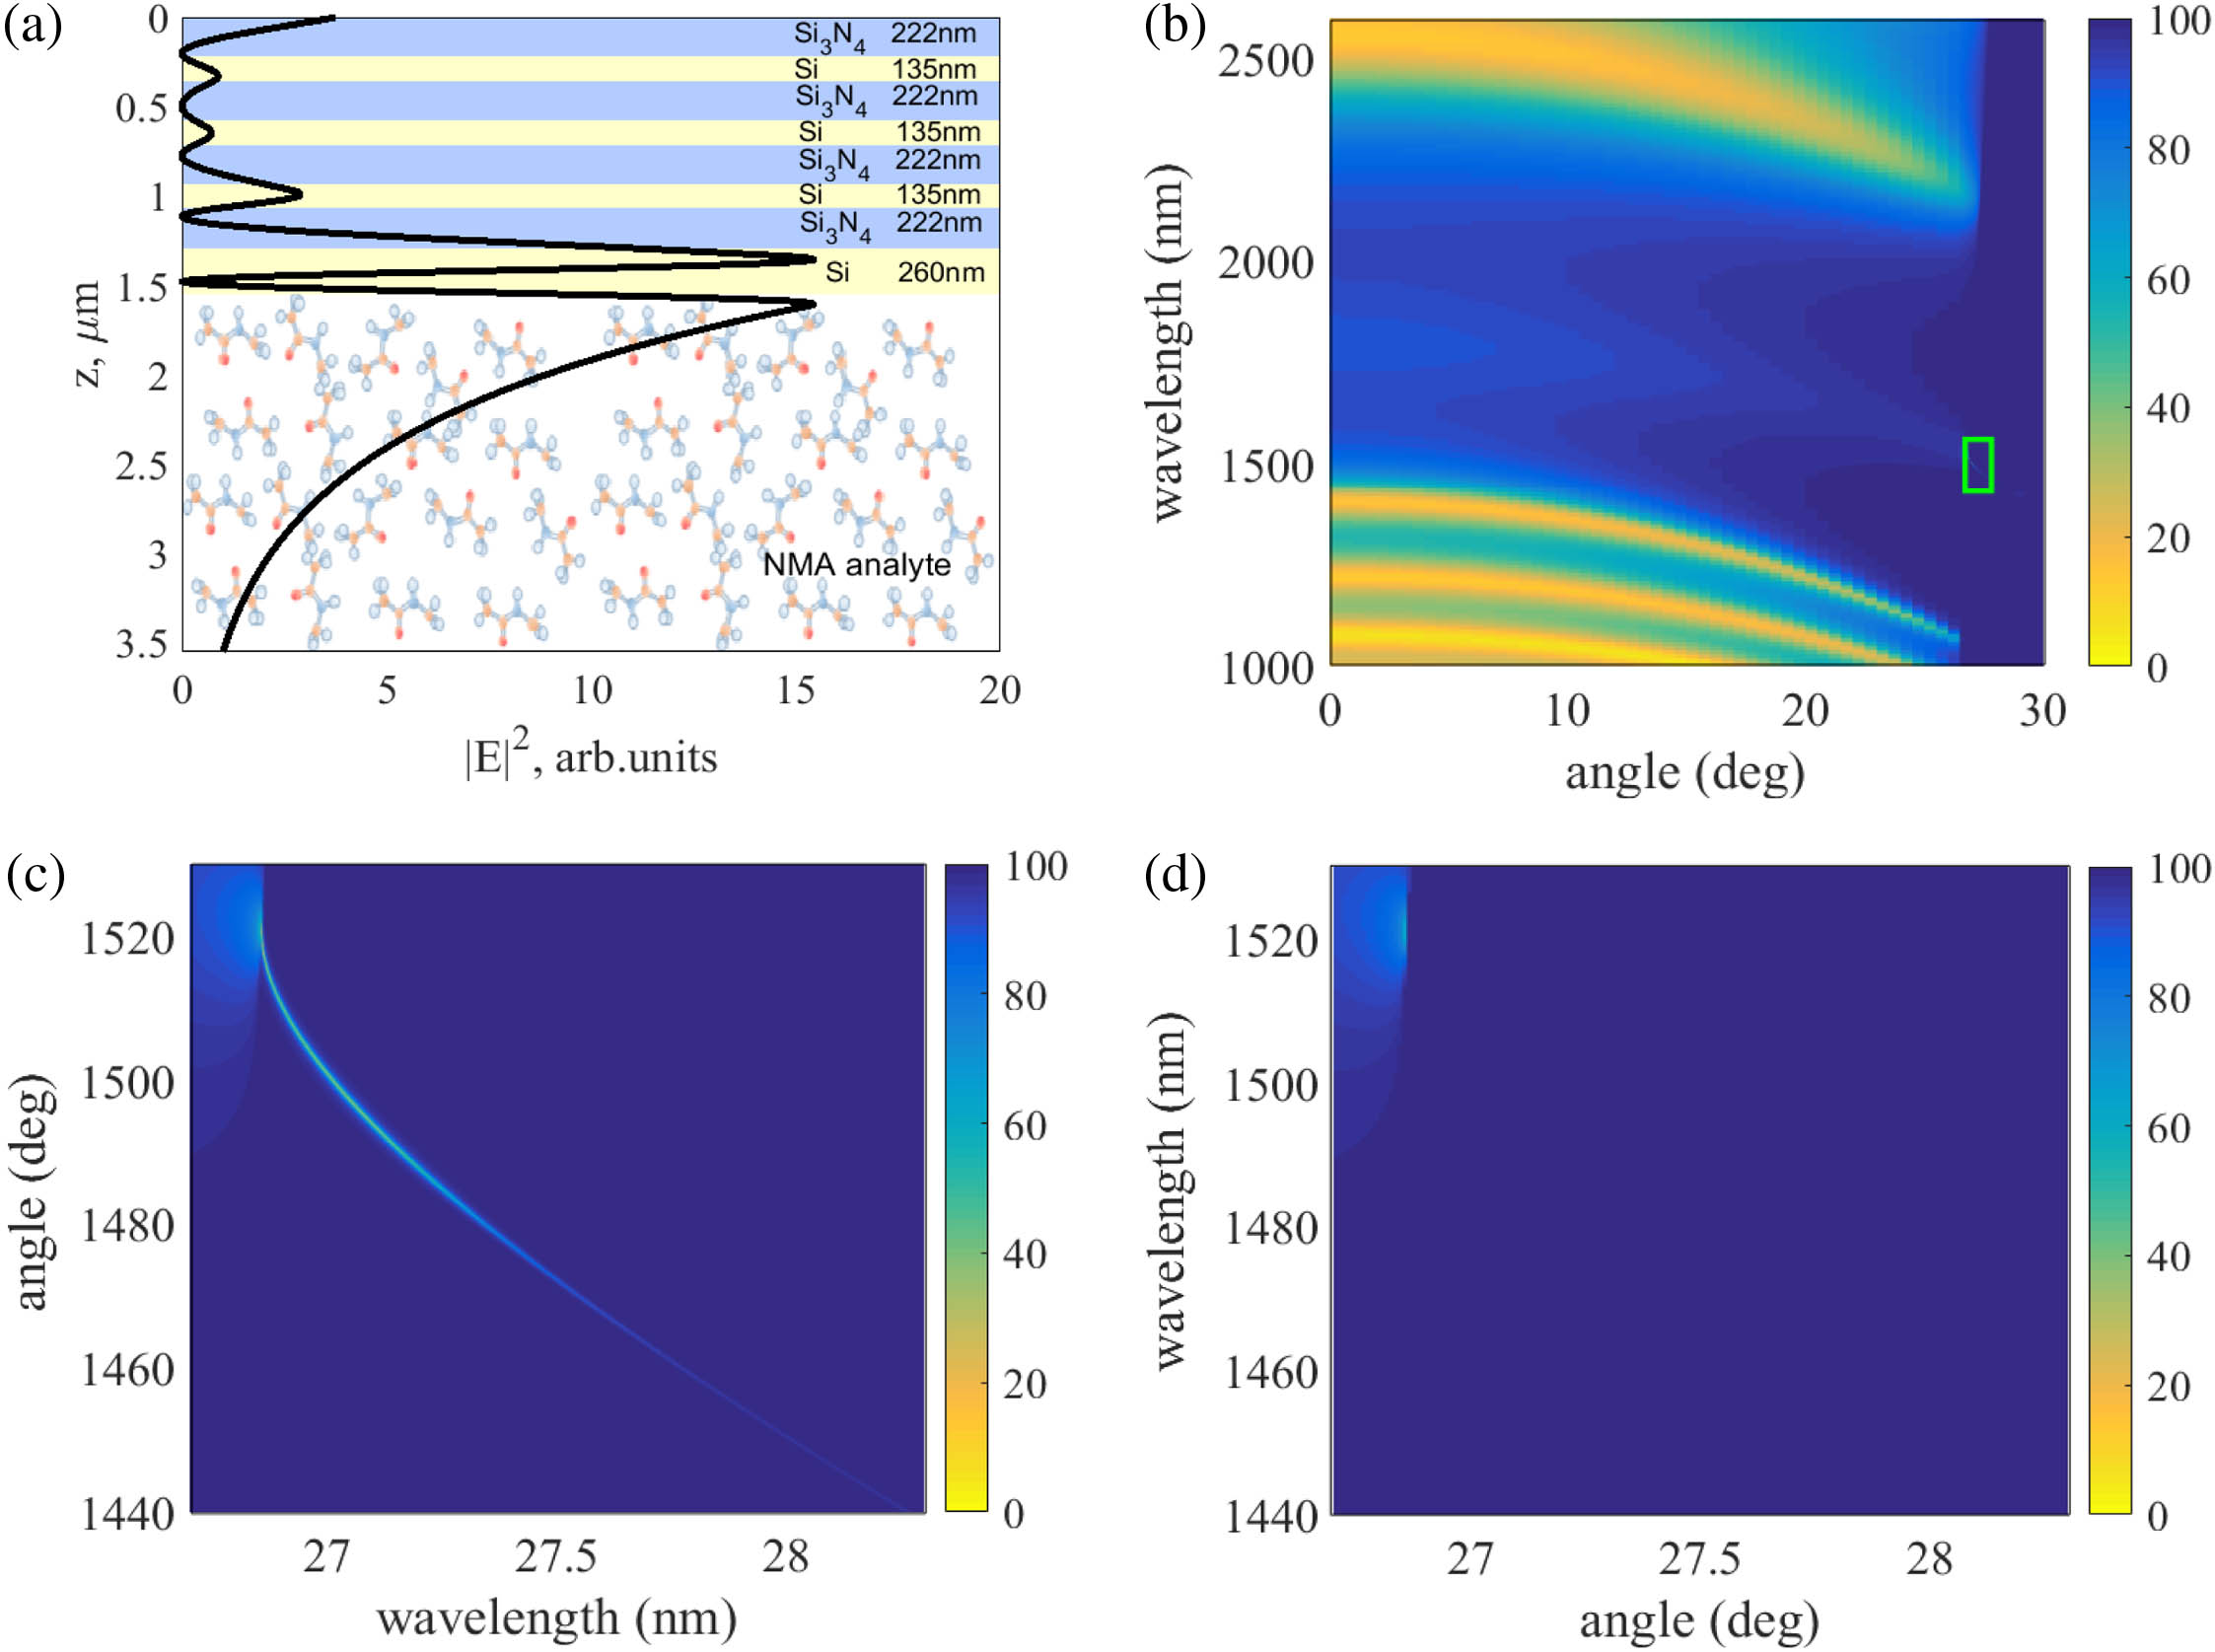
    Fig. 2. (a) PC structure scheme and the electromagnetic field distribution of the mode inside the PC structure and NMA analyte. The reflectance spectrum (incidence angle versus wavelength) of the PC-based structure for superhigh Q sensing; (b) large scale, the position of the excited mode with respect to the PC BG and total internal reflection angle, shown by green rectangle; (c) magnified scale showing the ultrahigh-Q of the excited mode; (d) magnified scale showing the disappearance of the resonance in the case of zero absorption.
    Magnetic sensing structure with TM-polarized quasi-surface mode. (a) Reflectance (R) and (b) TMOKE magnified scale wavelength versus angle plot showing the ultrahigh-Q of the excited mode and corresponding enhancement of the MO response; (c) R (solid line), ΔR (dashed line), and TMOKE δR (dotted line) angular spectra at the resonance wavelength 1.495 μm; (d) angular spectra of sensitivity of optical and MO response to the extinction coefficient of the analyte, dR/dn′′ and d(dR/R)/dn′′.
    Fig. 3. Magnetic sensing structure with TM-polarized quasi-surface mode. (a) Reflectance (R) and (b) TMOKE magnified scale wavelength versus angle plot showing the ultrahigh-Q of the excited mode and corresponding enhancement of the MO response; (c) R (solid line), ΔR (dashed line), and TMOKE δR (dotted line) angular spectra at the resonance wavelength 1.495 μm; (d) angular spectra of sensitivity of optical and MO response to the extinction coefficient of the analyte, dR/dn and d(dR/R)/dn.
    Relative magnitude I/I0 of the quasi-surface wave intensity in the disturbed structure normalized on the surface wave intensity in the nondisturbed structure I0, with respect to the magnitude of δwj in nanometers and δnj in refractive index units (RIU) deviations from the designed values averaged over 100 randomly generated deviations.
    Fig. 4. Relative magnitude I/I0 of the quasi-surface wave intensity in the disturbed structure normalized on the surface wave intensity in the nondisturbed structure I0, with respect to the magnitude of δwj in nanometers and δnj in refractive index units (RIU) deviations from the designed values averaged over 100 randomly generated deviations.
    Normalized reflectance (in percents of light energy reflected by the structure normalized to the incident energy) versus angle of incidence (degrees) of superhigh Q resonance at the wavelength of the incident light 1.495 μm. Resonant curves corresponding to different thicknesses of the bottom Si layer, 255 nm (black solid curve), 260 nm (red dashed curve), and 265 nm (blue dotted curve).
    Fig. 5. Normalized reflectance (in percents of light energy reflected by the structure normalized to the incident energy) versus angle of incidence (degrees) of superhigh Q resonance at the wavelength of the incident light 1.495 μm. Resonant curves corresponding to different thicknesses of the bottom Si layer, 255 nm (black solid curve), 260 nm (red dashed curve), and 265 nm (blue dotted curve).
    Normalized reflectance (in percents of light energy reflected by the structure normalized to the incident energy) versus angle of incidence (degrees) of superhigh Q resonance at the wavelength of the incident light 1.495 μm. Resonant curves in the cases of absorbing (n′′=10−4, red solid curve) and nonabsorbing (n′′=0, blue dashed curve) analyte material with the same real part of the refractive index.
    Fig. 6. Normalized reflectance (in percents of light energy reflected by the structure normalized to the incident energy) versus angle of incidence (degrees) of superhigh Q resonance at the wavelength of the incident light 1.495 μm. Resonant curves in the cases of absorbing (n=104, red solid curve) and nonabsorbing (n=0, blue dashed curve) analyte material with the same real part of the refractive index.
    Scheme of the magnetic PC nanostructure in the external magnetic field H. Input and reflected light at 1.495 μm is shown with red arrows.
    Fig. 7. Scheme of the magnetic PC nanostructure in the external magnetic field H. Input and reflected light at 1.495 μm is shown with red arrows.
    O. V. Borovkova, D. O. Ignatyeva, S. K. Sekatskii, A. Karabchevsky, V. I. Belotelov. High-Q surface electromagnetic wave resonance excitation in magnetophotonic crystals for supersensitive detection of weak light absorption in the near-infrared[J]. Photonics Research, 2020, 8(1): 57
    Download Citation