
Xin HE, Meiqi SONG, Xiaojing LIU. Uncertainty quantification methodology for model parameters in sub-channel codes using MCMC sampling[J]. NUCLEAR TECHNIQUES, 2023, 46(12): 120602
- NUCLEAR TECHNIQUES
- Vol. 46, Issue 12, 120602 (2023)
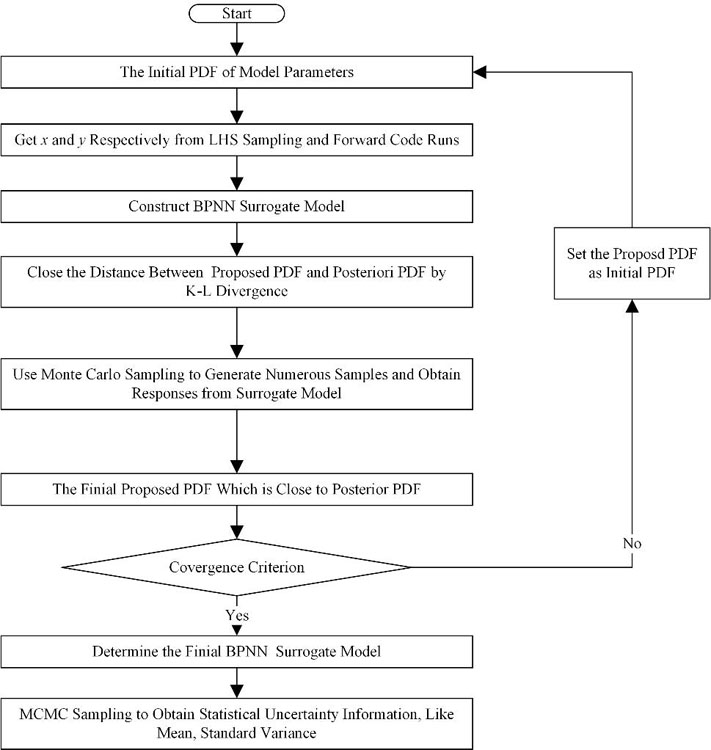
Fig. 1. Flowchart of uncertainty analysis
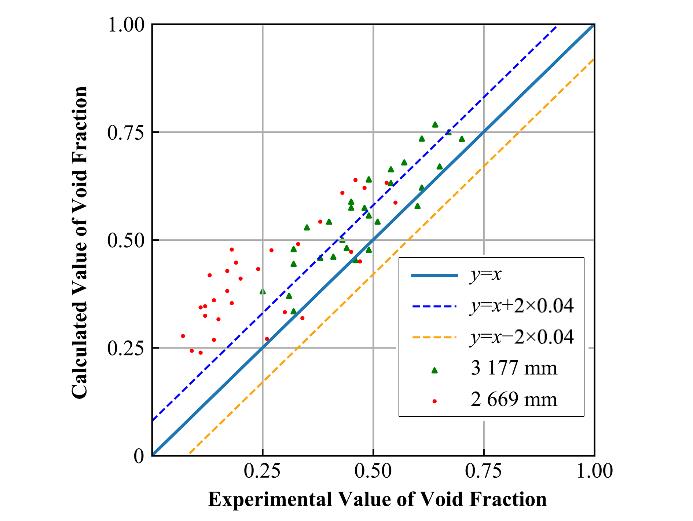
Fig. 2. Comparison between the experimental and calculated void fraction values
Fig. 3. Error decline curve when establishing the BPNN surrogate model
Fig. 4. Sample path of the adaptive Metropolis algorithm (a) Random-walk samples from s, (b) Random-walk samples from β
Fig. 5. Frequency histogram of 20 000 iteration samples (a) Frequency histogram of s, (b) Frequency histogram of β
Fig. 6. Envelop test for 95% confidence interval (a) Void fraction at 2 669 mm, (b) Void fraction at 3 177 mm
Fig. 7. Calibration resultsof the two modified model parameters (a) Void fraction at 2 669 mm, (b) Void fraction at 3 177 mm
|
Table 1. Proposed parameters for adaptive encryption
|
Table 2. Uncertainty distribution of boundary condition parameters
|
Table 3. Parameters proposed by adaptive algorithm iterations
|
Table 4. Uncertainty distribution of the mean and standard variance for the model parameters

Set citation alerts for the article
Please enter your email address
© Copyright 2018-2021 | Chinese Laser Press. All Rights Reserved 沪ICP备15018463号-20