Author Affiliations
1College of Electrical Engineering, Zhejiang University, Hangzhou, Zhejiang 310027, China2Institute of Computer Application Technology, Hangzhou Dianzi University, Hangzhou, Zhejiang 310018, Chinashow less
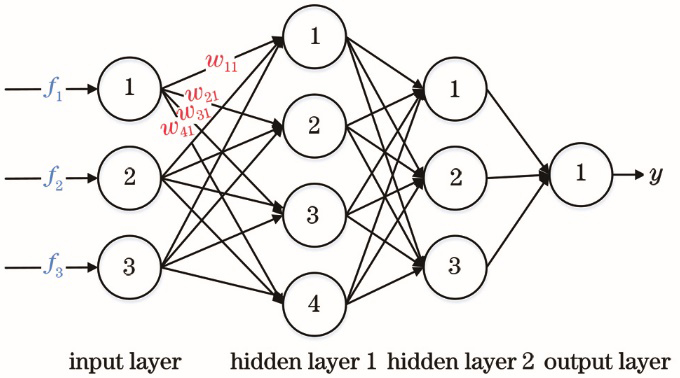
Fig. 1. Structural diagram of multilayer perceptron with 2 hidden layers
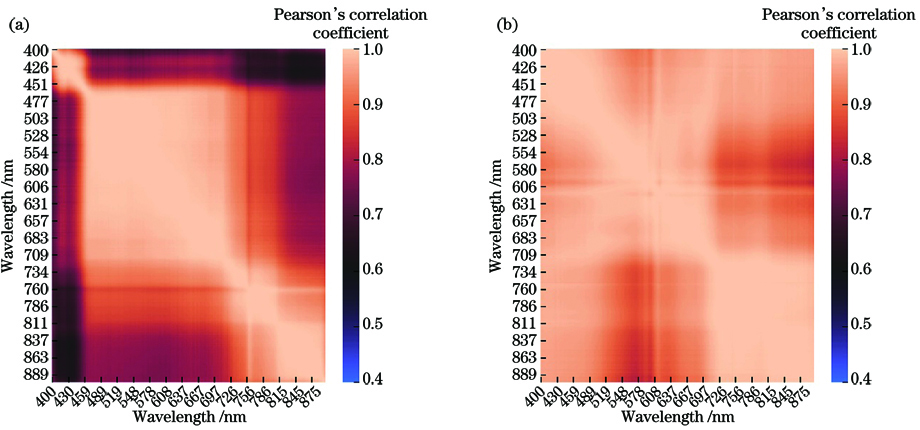
Fig. 2. Correlation matrices of remote sensing reflectance data. (a) March 11, 2019; (b) August 5, 2019
Fig. 3. Neural network structure in PNN algorithm
Fig. 4. Sum of entropy of different algorithms when M=12. (a) March 11, 2019; (b) August 5, 2019
| Date | Cmin | Cmax | Cmean | Cstd |
|---|
| 2019-03-11 | 4.00 | 18.00 | 6.89 | 8.10 | | 2019-08-05 | 4.00 | 14.00 | 8.00 | 10.32 |
|
Table 1. Statistical results of SPM concentration mg·L-1
| Date | Spectral resolution | Minimum wavelength | Maximum wavelength |
|---|
| 2019-03-11 | 1.98 | 399.87 | 997.58 | | 2019-08-05 | 1.00 | 325.00 | 1075.00 |
|
Table 2. Statistical results of hyperspectral data measured by handheld spectrometersnm
| Number of bands | MSE | MAE |
|---|
| DTBS | SVM-RFE | PNN-L1 | PNN-L2 | PNN-ReLU | DTBS | SVM-RFE | PNN-L1 | PNN-L2 | PNN-ReLU |
|---|
| 6 | 20.13 | 11.69 | 6.75 | 7.10 | 5.58 | 2.78 | 2.10 | 1.43 | 1.04 | 1.15 | | 9 | 12.77 | 11.53 | 4.77 | 8.40 | 5.81 | 2.03 | 1.46 | 1.10 | 1.27 | 1.14 | | 12 | 6.26 | 12.78 | 5.58 | 6.31 | 5.89 | 1.24 | 2.22 | 1.17 | 1.23 | 1.18 | | 15 | 12.99 | 6.95 | 9.04 | 5.11 | 6.40 | 2.03 | 1.60 | 1.30 | 1.23 | 1.18 | | 18 | 16.26 | 16.96 | 4.35 | 4.41 | 7.00 | 2.42 | 2.05 | 0.95 | 1.02 | 1.02 | | 21 | 19.32 | 8.85 | 3.32 | 8.53 | 5.09 | 2.88 | 1.54 | 0.80 | 1.38 | 1.21 | | 24 | 10.11 | 5.12 | 10.88 | 4.04 | 5.19 | 1.81 | 1.08 | 1.64 | 0.85 | 1.19 | | 27 | 13.18 | 20.84 | 4.65 | 5.79 | 7.62 | 2.04 | 2.74 | 1.00 | 1.03 | 1.13 | | 30 | 11.91 | 13.72 | 5.81 | 5.16 | 7.42 | 1.90 | 2.39 | 1.27 | 0.93 | 1.39 | | 33 | 11.74 | 17.73 | 7.11 | 3.88 | 4.83 | 1.93 | 1.99 | 1.47 | 0.79 | 1.04 | | 36 | 12.84 | 17.02 | 7.33 | 3.98 | 5.81 | 1.89 | 2.10 | 1.34 | 0.91 | 1.22 | | 39 | 12.54 | 18.99 | 3.40 | 3.55 | 6.42 | 2.08 | 2.25 | 1.06 | 0.81 | 1.34 | | 42 | 10.79 | 10.80 | 8.16 | 4.69 | 5.58 | 1.87 | 1.72 | 1.31 | 1.15 | 1.13 | | 45 | 14.83 | 15.41 | 4.80 | 5.19 | 7.85 | 2.04 | 2.57 | 1.05 | 1.06 | 1.28 | | 48 | 7.60 | 15.67 | 8.92 | 4.23 | 4.95 | 1.44 | 2.42 | 1.82 | 0.92 | 1.16 |
|
Table 3. Experimental result comparison of SPM concentration inversion using neural network (March 11, 2019)
| Number of bands | MSE | MAE |
|---|
| DTBS | SVM-RFE | PNN-L1 | PNN-L2 | PNN-ReLU | DTBS | SVM-RFE | PNN-L1 | PNN-L2 | PNN-ReLU |
|---|
| 6 | 13.24 | 30.33 | 3.92 | 6.62 | 5.99 | 1.91 | 3.48 | 1.25 | 1.40 | 1.47 | | 9 | 15.70 | 29.17 | 8.28 | 5.22 | 5.27 | 2.17 | 3.47 | 1.69 | 1.38 | 1.31 | | 12 | 11.07 | 11.83 | 5.71 | 7.34 | 9.55 | 1.61 | 2.12 | 1.40 | 1.38 | 1.70 | | 15 | 25.21 | 14.88 | 3.18 | 8.10 | 7.16 | 3.02 | 1.83 | 1.00 | 1.58 | 1.44 | | 18 | 7.94 | 20.71 | 3.26 | 8.75 | 7.20 | 1.78 | 2.84 | 1.01 | 1.40 | 1.76 | | 21 | 20.94 | 17.03 | 8.85 | 8.54 | 7.27 | 2.70 | 2.49 | 1.84 | 1.88 | 1.51 | | 24 | 12.06 | 7.65 | 4.08 | 8.30 | 6.51 | 1.79 | 1.67 | 1.18 | 1.64 | 1.41 | | 27 | 16.35 | 14.83 | 5.72 | 6.29 | 4.53 | 2.29 | 2.32 | 1.45 | 1.42 | 0.97 | | 30 | 18.49 | 15.19 | 3.08 | 5.19 | 13.17 | 2.46 | 2.46 | 1.12 | 1.22 | 2.27 | | 33 | 18.72 | 17.89 | 6.15 | 7.92 | 8.61 | 2.55 | 2.34 | 1.28 | 1.53 | 1.57 | | 36 | 3.73 | 17.48 | 7.45 | 7.76 | 3.60 | 1.06 | 2.54 | 1.64 | 1.66 | 1.10 | | 39 | 16.48 | 12.57 | 7.23 | 5.92 | 6.59 | 2.39 | 1.81 | 1.45 | 1.41 | 1.28 | | 42 | 15.60 | 40.47 | 4.83 | 7.54 | 4.31 | 2.15 | 4.21 | 1.35 | 1.68 | 1.14 | | 45 | 14.53 | 20.30 | 4.02 | 6.90 | 5.91 | 2.36 | 2.7 | 1.07 | 1.50 | 1.53 | | 48 | 20.01 | 15.78 | 10.00 | 5.91 | 6.80 | 2.56 | 2.52 | 1.77 | 1.43 | 1.28 |
|
Table 4. Experimental result comparison of SPM concentration inversion using neural network model (August 5, 2019)
| Number of bands | MSE | MAE |
|---|
| DTBS | SVM-RFE | PNN-L1 | PNN-L2 | PNN-ReLU | DTBS | SVM-RFE | PNN-L1 | PNN-L2 | PNN-ReLU |
|---|
| 6 | 11.36 | 10.89 | 12.89 | 12.58 | 10.61 | 2.40 | 2.49 | 2.30 | 2.36 | 2.32 | | 9 | 11.45 | 12.05 | 10.54 | 12.20 | 11.50 | 2.29 | 2.63 | 2.27 | 2.27 | 2.59 | | 12 | 10.83 | 11.36 | 13.63 | 12.64 | 12.36 | 2.17 | 2.51 | 2.34 | 2.33 | 2.54 | | 15 | 12.20 | 11.21 | 11.34 | 11.73 | 13.78 | 2.37 | 2.47 | 2.74 | 2.27 | 2.56 | | 18 | 12.20 | 11.92 | 12.19 | 12.17 | 12.51 | 2.35 | 2.59 | 2.38 | 2.46 | 2.61 | | 21 | 11.06 | 11.38 | 11.46 | 11.73 | 12.90 | 2.35 | 2.57 | 2.43 | 2.33 | 2.77 | | 24 | 10.45 | 11.55 | 14.87 | 10.47 | 16.36 | 2.24 | 2.57 | 2.28 | 2.31 | 3.06 | | 27 | 11.54 | 11.56 | 11.60 | 11.54 | 13.77 | 2.45 | 2.40 | 2.49 | 2.45 | 2.76 | | 30 | 11.59 | 10.49 | 10.76 | 16.75 | 11.41 | 2.25 | 2.44 | 2.39 | 2.88 | 2.52 | | 33 | 11.34 | 10.85 | 13.36 | 12.73 | 10.47 | 2.29 | 2.46 | 2.40 | 2.59 | 2.25 | | 36 | 12.09 | 11.78 | 13.73 | 11.77 | 11.99 | 2.34 | 2.56 | 2.48 | 2.42 | 2.42 | | 39 | 10.75 | 10.76 | 12.46 | 12.22 | 11.18 | 2.34 | 2.44 | 2.62 | 2.44 | 2.51 | | 42 | 11.40 | 12.73 | 13.64 | 13.06 | 12.79 | 2.36 | 2.64 | 2.41 | 2.62 | 2.69 | | 45 | 10.98 | 11.22 | 11.62 | 11.30 | 10.92 | 2.29 | 2.51 | 2.93 | 2.32 | 2.37 | | 48 | 12.77 | 11.33 | 11.41 | 11.06 | 11.71 | 2.41 | 2.41 | 2.36 | 2.42 | 2.41 |
|
Table 5. Experimental result comparison of SPM concentration inversion using random forest model (March 11, 2019)
| Number of bands | MSE | MAE |
|---|
| DTBS | SVM-RFE | PNN-L1 | PNN-L2 | PNN-ReLU | DTBS | SVM-RFE | PNN-L1 | PNN-L2 | PNN-ReLU |
|---|
| 6 | 8.91 | 8.45 | 9.46 | 8.42 | 10.11 | 2.40 | 2.21 | 2.37 | 2.18 | 2.45 | | 9 | 9.05 | 8.89 | 10.11 | 8.15 | 8.37 | 2.29 | 2.32 | 2.40 | 2.19 | 2.29 | | 12 | 8.46 | 8.97 | 8.68 | 8.69 | 8.56 | 2.17 | 2.30 | 2.30 | 2.24 | 2.25 | | 15 | 8.20 | 8.38 | 8.85 | 8.69 | 7.99 | 2.37 | 2.29 | 2.18 | 2.19 | 2.30 | | 18 | 8.08 | 8.84 | 9.72 | 8.09 | 8.70 | 2.35 | 2.28 | 2.43 | 2.20 | 2.45 | | 21 | 8.63 | 8.80 | 8.58 | 8.42 | 7.34 | 2.35 | 2.36 | 2.19 | 2.19 | 2.19 | | 24 | 8.11 | 8.05 | 7.80 | 9.69 | 7.95 | 2.24 | 2.27 | 2.08 | 2.45 | 2.23 | | 27 | 8.03 | 8.43 | 9.22 | 8.33 | 8.01 | 2.45 | 2.20 | 2.29 | 2.14 | 2.23 | | 30 | 8.46 | 8.59 | 8.81 | 8.23 | 9.36 | 2.25 | 2.28 | 2.33 | 2.17 | 2.59 | | 33 | 8.54 | 8.95 | 10.48 | 7.64 | 9.60 | 2.29 | 2.30 | 2.47 | 2.06 | 2.54 | | 36 | 9.36 | 8.18 | 8.15 | 8.78 | 7.73 | 2.34 | 2.24 | 2.17 | 2.30 | 2.14 | | 39 | 9.01 | 8.94 | 12.37 | 9.03 | 6.95 | 2.34 | 2.26 | 2.69 | 2.29 | 2.04 | | 42 | 8.42 | 8.63 | 8.77 | 7.01 | 7.03 | 2.36 | 2.28 | 2.30 | 2.03 | 2.18 | | 45 | 8.15 | 8.43 | 11.38 | 7.98 | 7.18 | 2.29 | 2.22 | 2.67 | 2.12 | 2.14 | | 48 | 7.80 | 8.18 | 8.36 | 7.48 | 7.19 | 2.41 | 2.20 | 2.28 | 2.00 | 2.09 |
|
Table 6. Experimental result comparison of SPM concentration inversion using random forest model (August 5, 2019)