• Laser & Optoelectronics Progress
  • Vol. 56, Issue 6, 062601 (2019)
Man Peng1、3, Zhongchen Bai2, Ying Zhang2, Xianji Li2, and Zhengping Zhang2、*
Author Affiliations
  • 1 College of Big Data and Information Engineering, Guizhou University, Guiyang, Guizhou 550025, China
  • 2 Key Laboratory for Photoelectronics and Application Technology, Guizhou University, Guiyang, Guizhou 550025, China
  • 3 School of Mechanical & Electrical Engineering, Guizhou Normal University, Guiyang, Guizhou 550025, China;
  • show less
    DOI: 10.3788/LOP56.062601 Cite this Article Set citation alerts
    Man Peng, Zhongchen Bai, Ying Zhang, Xianji Li, Zhengping Zhang. Protein Detection Chip Based on Quantum Dot Fluorescence Quenching Method[J]. Laser & Optoelectronics Progress, 2019, 56(6): 062601 Copy Citation Text show less
    Principle of protein-chip detection. (a) Chip structure; (b) detection principle
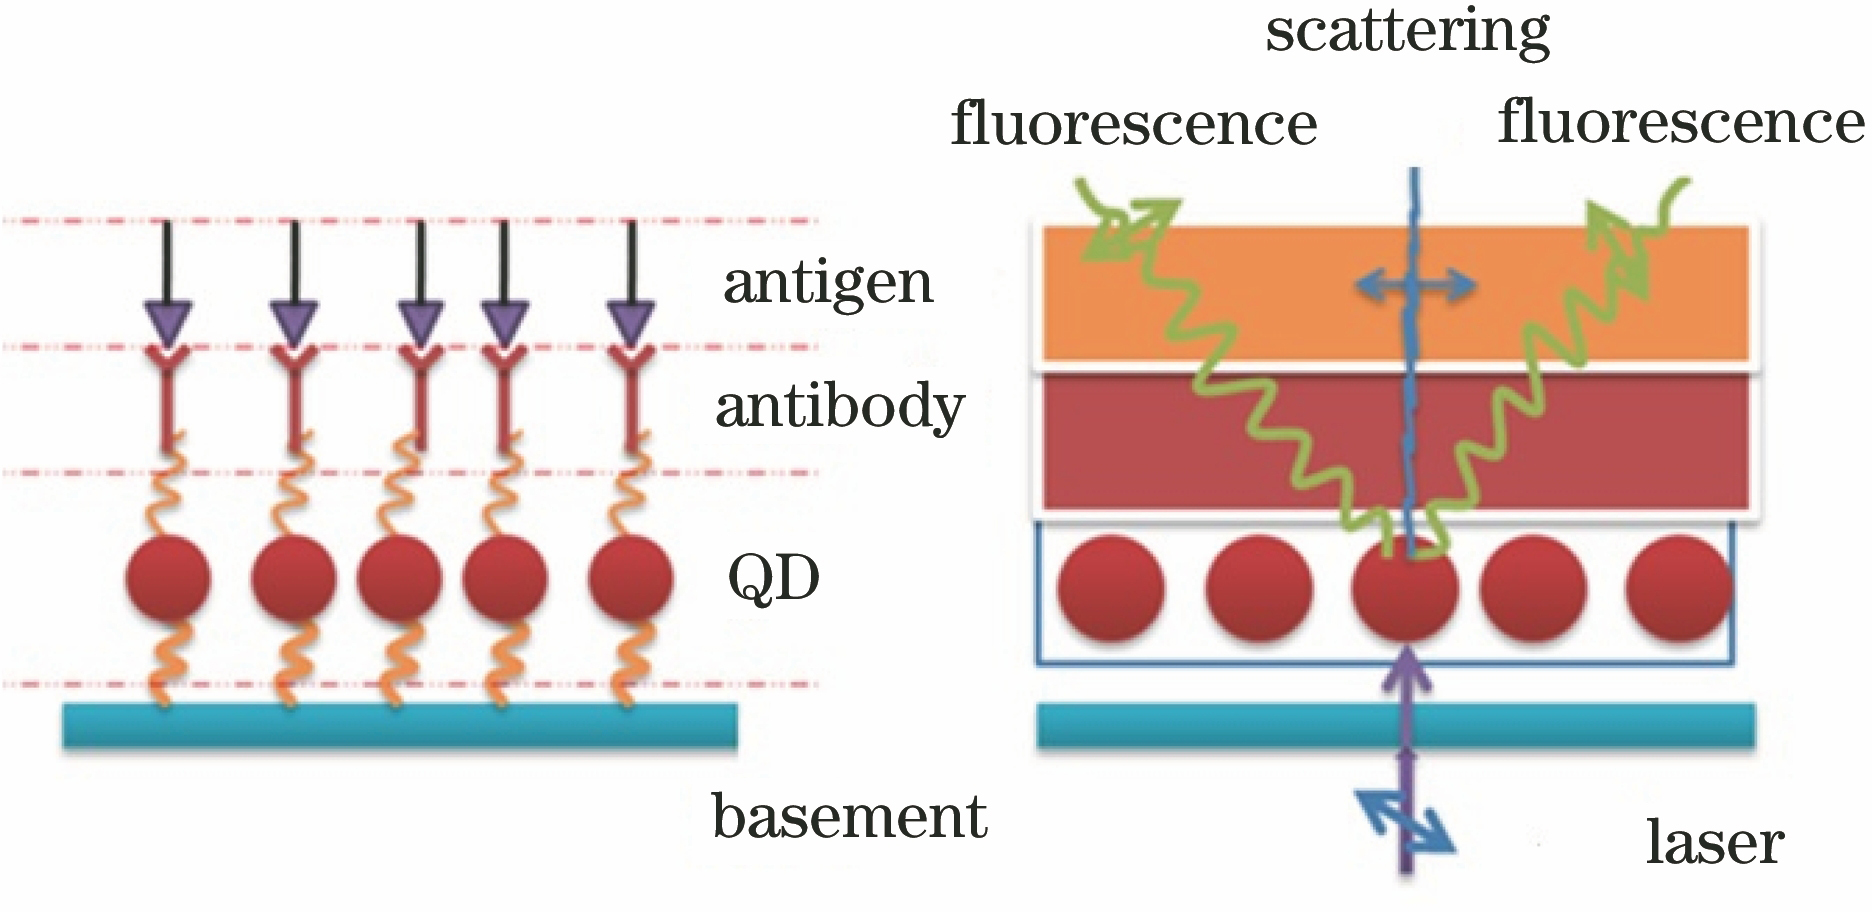
    Fig. 1. Principle of protein-chip detection. (a) Chip structure; (b) detection principle
    Experimental setup. (a) Block diagram; (b) prototype photo
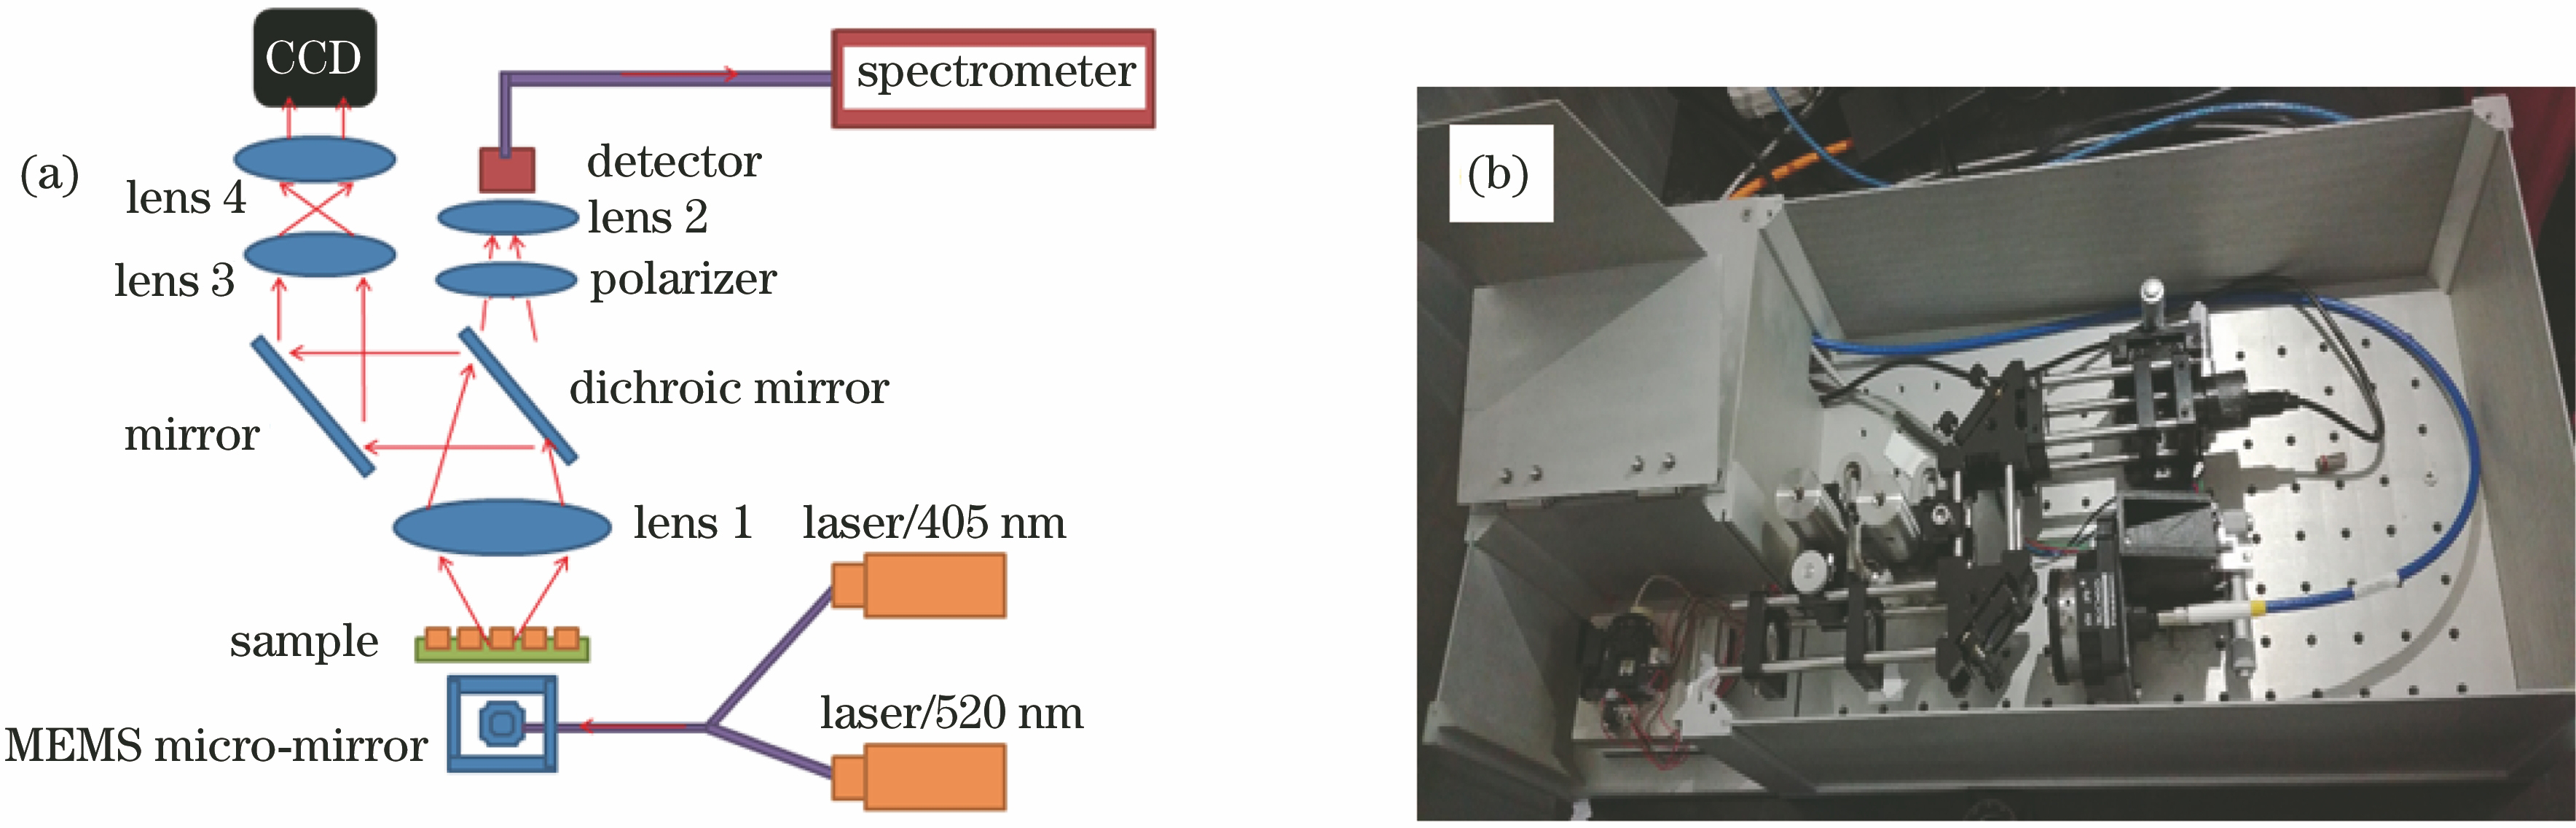
    Fig. 2. Experimental setup. (a) Block diagram; (b) prototype photo
    AFM of glass substrate. (a) Unmodified; (b) modified
    Fig. 3. AFM of glass substrate. (a) Unmodified; (b) modified
    Infrared Fourier transform spectrum of glass substrate modified by APTES
    Fig. 4. Infrared Fourier transform spectrum of glass substrate modified by APTES
    Nanometer quantum dot biochip array. (a) Surface, the inset is an array unit photo; (b) fluorescence, the inset is a fluorescent image
    Fig. 5. Nanometer quantum dot biochip array. (a) Surface, the inset is an array unit photo; (b) fluorescence, the inset is a fluorescent image
    Nanometer quantum dot biochip array unit. (a)-(c) Photos; (d)-(f) fluorescent images after binding antibodies; (g)-(i) fluorescent images after binding antigens on antibody substrate
    Fig. 6. Nanometer quantum dot biochip array unit. (a)-(c) Photos; (d)-(f) fluorescent images after binding antibodies; (g)-(i) fluorescent images after binding antigens on antibody substrate
    Relationship between NGF concentration and fluorescence peak intensity. (a) 0-100 ng·mL-1; (b) partial enlargement
    Fig. 7. Relationship between NGF concentration and fluorescence peak intensity. (a) 0-100 ng·mL-1; (b) partial enlargement
    No.12345678910111213
    Concentration ofAg-V /(ng·mL-1)0.10.20.51.02.55.07.510.012.517.520.050.0100.0
    FQD /arb. units6.52.6517.773.8545.68126.68143.76158.16205.68273.72344.28447.84454.72
    Table 1. Fluorescence quenchingdegrees under different antigen concentrations
    Man Peng, Zhongchen Bai, Ying Zhang, Xianji Li, Zhengping Zhang. Protein Detection Chip Based on Quantum Dot Fluorescence Quenching Method[J]. Laser & Optoelectronics Progress, 2019, 56(6): 062601
    Download Citation