Abstract
In order to realize single emissive white phosphorescent organic light-emitting devices (PHOLEDs) with three color phosphorescent dopants (red, green, and blue), the energy transfer between the host material and the three dopants, as well as the among the three dopants themselves, should be considered and optimized. To explore the effect of red phosphorescent dopant on the color rendering index (CRI), the authors investigate the wavelength position of the maximum emission peak from three phosphorescent dopants. The CRI and luminous efficiency of white PHOLED in which acts as the red phosphorescent dopant are found to be greater than those of devices prepared using and as the emission spectrum has a relatively high intensity near the human perception of blue, red, and green wavelengths. Furthermore, we demonstrate that the performance of the three dopants is related to the absorption characteristics of the red phosphorescent dopant. With a maximum emission peak at 600 nm, has a higher intensity in the concave section between 550 and 600 nm seen for red and blue dopants. In addition, the long metal-to-ligand charge transfer (MLCT) absorption tail of overlaps with the emission spectra of the green dopant, enhancing emission. Such energy transfer mechanisms are confirmed to optimize white emission in the single emissive white PHOLEDs.Considerable attention has been paid to white organic light-emitting devices (OLEDs) in flat panel displays (FPDs) and solid-state lighting in the next generation due to several potential advantages such as diffusive emission of surfaces, large-range area manufacturability, ecofriendliness, and effective fabrication process for the cost[1–9]. Such interesting advantages in white OLEDs have activated the field and, though they are entering the marketplace, outstanding challenges in achieving high efficiency and color rendering index (CRI) still remain. A key strategy for improving the efficiency in white OLEDs is to increase the external quantum efficiency to 100% by harvesting both singlet and triplet excitons. This is possible in a phosphorescent OLED (PHOLED)[10–12]. In the case of the longterm degradation processes, they need both optimized device structure considering organic materials in each functional layerand a good encapsulation process. Many structures have been attempted for white OLEDs to achieve a high performance[13–18]. The most easily manufacturable and simplest structures for PHOLEDs are single emissive layer (SEL) devices with phosphorescent dopants. SEL in OLEDs means only one emitting layer in the OLED device. On the other hand, multi-emissive layer (MEL) defines two, or more than two, different and distinct emitting layers in OLED devices. Though two white dopant in PHOLEDs have been realized, their low CRI makes them unsuitable for a variety of applications. It is relatively easy to control the energy transfer between two dopants in an SEL as there is only one energy transfer from a higher energy dopant to a lower energy one. Three color dopants in a single layer should lead to a higher performance and better CRI; however, the interplay of energy among the excitons of the three dopants makes it complicated to optimize the performance[19–22]. In this study, single emissive white PHOLEDs were fabricated to obtain a high efficiency and a simple structure via control of the exciton energy transfer in an SEL with red, green, and blue dopants. By varying three red dopants, (Tris[1-phenylisoquinoline-C2,N]iridium(III)), (Bis(1-phenylisoquinoline)(acetylacetonate)iridium(III)), or ((bis(2-(2′-benzothienyl)-pyridinato-N,C3′)iridium(acetylacetonate))), we have demonstrated different energy transfer mechanisms and CRI in an SEL with the three colors system.
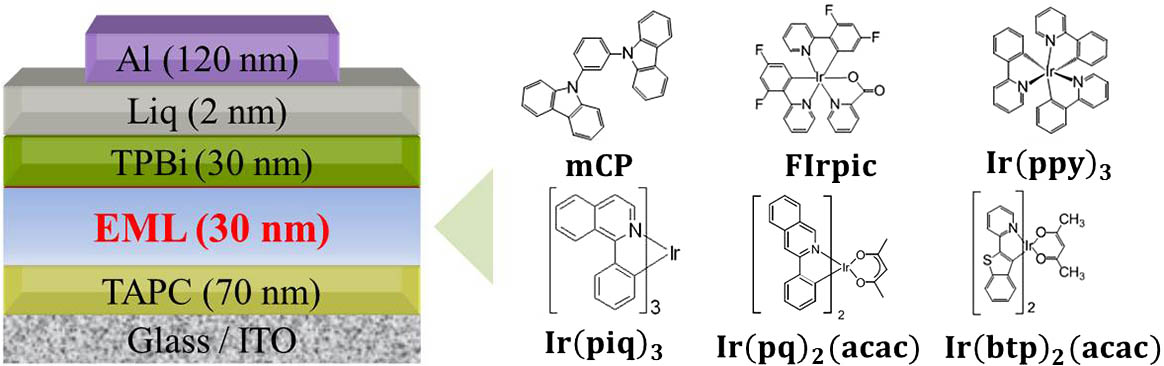
White PHOLEDs were fabricated using the device architecture: ITO (150 nm; indium tin oxide)/TAPC (70 nm; 1,1-bis[(di-4-tolylamino)phenyl]cyclohexane)/mCP (N,N′-dicarbazolyl-3,5-benzene): FIrpic–8.0% (Bis[2-(4,6-difluorophenyl)pyridinato-C2,N](picolinato)iridium(III)): –0.5% (Tris(2-phenylpyridine)iridium(III)): three different red phosphorescent dopants–x % (, , and ) (30 nm)/TPBi (2′,2′,2′′-(1,3,5-benzinetriyl)-tris(1-phenyl-1-H-benzimidazole)) (30 nm)/Liq (2 nm; 8-Hydroxyquinolinolato-lithium)/Al (120 nm; aluminum). ITO-coated glasses with a sheet resistance of were used as a substrate and line patterns of ITO were formed using a photolithography process. The ITO glass substrates were cleaned in an ultrasonic bath in the following order: deionized water, isopropyl alcohol, acetone, deionized water, and isopropyl alcohol, and then treated with plasma under vacuum conditions () at 50 W for 2 min. All organic materials were deposited by thermal evaporation at a pressure of . To fabricate white PHOLEDs we used TAPC as the HTL material; mCP as the host material; FIrpic, and as blue and green phosphorescent dopants, respectively; TPBi as the ETL material; and an electron injection layer of Liq. The red phosphorescent dopant, , , or , was varied between 0.2 and 0.8 wt%. The Al cathode electrode was deposited by a thermal evaporation system at a rate of evaporation of 0.5 nm/s. All the devices had an active region of , as realized by the shadow mask used for deposition of the cathode electrode. The electrical and optical performances of the white PHOLEDs were evaluated by using a Keithley 238 LMS PR-650 spectrophotometer, a colorimeter, and a current density-voltage-luminance (J-V-L) system. The emission/absorption spectra of the organic materials were measured in at room temperature. A schematic structure of the white PHOLEDs containing three different red dopants (hereafter referred to as series of PHOLEDs A, B, or C) and organic molecular structures in an emissive layer are shown in Fig. 1. Table 1 shows the summary of the different red phosphorescent dopant materials and the concentration used in the white PHOLEDs.
| Devices | EML configuration of Devices A1–A4, B1–B4, and C1–C4 of White PHOLEDs |
|---|
| White PHOLED A1–A4 | mCP:FIrpic−8.0%:Ir(ppy)3−0.5%:Ir(piq)3−x% |
| White PHOLED B1–B4 | mCP:FIrpic−8.0%:Ir(ppy)3−0.5%:Ir(pq)2(acac)−x% |
| White PHOLED C1–C4 | mCP:FIrpic−8.0%:Ir(ppy)3−0.5%:Ir(btp)2(acac)−x% |
Table 1. Schematic of the Different Red Phosphorescent Dopant Materials and Concentration Used in White PHOLEDs

Figure 1.Schematic structure of white PHOLEDs and configuration molecules of organic materials in EML.
Figures 2(a), 2(b), and 2(c) show FIrpic as a blue dopant, as a green dopant, and , , and as red dopants, respectively, in order to indicate the predicted photoluminescence (PL) of white OLED devices A, B, and C, which are calculated using the same condition. The color coordinates of the predicted PL spectra of devices A, B, and C are (0.331, 0.335), (0.351, 0.364), and (0.310, 0.336), respectively, which are all close to an ideal white emission at (0.33, 0.33). Even though there is a weak intensity of green emission compared to the other dopants, it is necessary to make the value close to the optimized white color coordinates of (0.33, 0.33) in this study. As shown in Fig. 2(d), the three predicted white spectra are differentiated in two segments according to the position of the highest peak of the red dopant. One is the concave part between 550 and 600 nm. The other is the shoulder peak extending from 620 nm beyond 750 nm. The predicted white B, based on , has a lower intensity around the wavelength in the shoulder part than the others. On the other hand, it has a higher intensity in the concave section between 550 and 600 nm than the others. This suggests that a device based on should have a higher CRI and efficiency due to the characteristics of human eyes. The color matching function (CMF) in Fig. 2(d) indicates the level of color irritation of human perception. The X, Y, and Z functions correspond to the red, green, and blue color perceptions, respectively. Figure 2 shows that the human eye is typically sensitive to the wavelengths between 550 and 600 nm, and does not perceive colors above 700 nm. Therefore, device B should appear brighter to human vision. In order to prove this higher CRI and efficiency using as a red dopant, we fabricated a series of white PHOLEDs with the red dopant concentration increased gradually by 0.2% from 0.2% to 0.8%.
Sign up for Chinese Optics Letters TOC. Get the latest issue of Chinese Optics Letters delivered right to you!Sign up now
Figure 2.(a–c) Predicted white OLED devices A, B, and C spectra (black line) combining the PL of the RGB of each dopant and the comparison based upon the CMF formula of X, Y, and Z.
As shown in Figs. 3(a), 3(b), and 3(c), the luminous efficiency of the white PhOLEDs decreased as the doping concentration of three different red phosphorescent dopants increased. This was due to the excess of triplet excitons of the red phosphorescent dopants participating in the emission as the doping concentration increased. This effect can be seen in Fig. 4 where CIEx increased and CIEy decreased toward the red region as the concentration increased. In addition, it should be noted that the electroluminescence (EL) intensity of the red peaks around 600 nm increased gradually as the doping concentration of the red phosphorescent dopants increased while the blue and green intensity was decreased.
Figure 3.(a–c) Luminous efficiencies – luminance characteristics of white PHOLEDs with different red phosphorescent dopants and (d) a comparison between optimized white PHOLEDs with 0.6%, 0.4%, and 0.8% dopant concentration, respectively.
Figure 4. coordinates of white PHOLEDs with different red phosphorescent dopants, (a) A1–A4, (b) B1–B4, (c) C1–C4 (the direction of the arrow is related to 5, 7.5, and 10 V, respectively), and (d) the EL spectrum of optimized devices A3, B2, and C4.
Figures 4(a), 4(b), and 4(c) show color coordinates of the white PHOLEDs. As the driving voltage increased CIEx decreased not only because of decreasing red emission but also increasing blue emission, whereas CIEy also decreased because of decreasing green emission. However, there is some evidence for green emission contributing to the EL spectra of devices A3, B2, and C4, showing a higher intensity at around 500 nm of wavelength, although we can see the decreased green emission in Figs. 4(a), 4(b), and 4(c). In fact, FIrpic has a higher first emission peak at around 475 nm and then intrinsically a lower second shoulder emission peak around 500 nm. As you can see in Fig. 4(d), there is a higher second shoulder emission peak and this can be explained by the contribution of to the white emission spectra. This phenomenon can be explained by the intrinsic characteristics of Dexter energy transfer with respect to triplet excitons transferring from higher to lower triplet energy levels. The excited triplet levels of mCP, FIrpic, and are 2.9, 2.7, and 2.4 eV, respectively, while , and are 2.0, 2.1, and 2.0 eV, respectively, calculated from the energy of the highest emission peak in the PL spectrum. , , and (the red dopants), which have lower triplet energy levels than FIrpic (the blue dopant) and (the green dopant), were the first to be saturated by triplet excitons, which were then transferred to FIrpic, generating more blue light emission, as shown in Fig. 4. Figure 4(d) shows a comparison of optimized EL spectrum of the white PHOLEDs A3, B2, and C4. As predicted,device B2 has a higher CRI, given in Table 2, than the other devices due to the compensation of the concave wavelength area between 550 and 600 nm. We found thatdevice C4 has a much lower intensity than the other devices, and much lower than that predicted, due to the limited metal-to-ligand charge transfer (MLCT) of .
| White PHOLEDs | Driving Voltage | Maximum Luminous Efficiency | CRI | ΔCIEXY from 5 V to 10 V | CIEXY at 10.0 V |
|---|
| Ir(piq)3, A3 | 4.5 V | 11.0 cd/A | 61.8 | (−0.072, −0.006) | (0.340, 0.375) |
| Ir(pq)2(acac), B2 | 4.5 V | 17.2 cd/A | 72.9 | (−0.060, −0.017) | (0.367, 0.402) |
| Ir(btp)2(acac), C4 | 5.0 V | 10.3 cd/A | 50.0 | (−0.060, −0.025) | (0.232, 0.388) |
Table 2. Summary of Electrical and Optical Properties of Optimized White PHOLEDs with Different Red Dopants A3, B2, and C4
Figure 5 shows the different absorption ability of each red dopant and their spectral overlap with the other dopants and the host material. As shown in Fig. 5, the Ir complexes show an intense ligand absorption energy band centered around 250–350 nm with a weak absorption energy band ranging from 350 nm to the visible wavelength region, which originates from the MLCT. This is the region that contributes to energy transfer among the host and dopants. In the case of the , this region ends abruptly around 525 nm, while and extend to 600 and 575 nm, respectively. Actually, the wavelength range from 525 to 575 nm is an important region for the red dopants because of its use of the most part of the green emission to render energy transfer. Therefore, does not fully absorb the green emission energy and has a lower overall emission intensity.
Figure 5.PL spectrum of mCP, FIrpic, and , and the EL spectrum of mCP as host materials and the absorption spectrum of (a) , (b) , and (c) .
Though the luminance characteristics are very different, Figs. 6(a), 6(b), and 6(c) show that J-V characteristics are unrelated to the doping concentration or the type of red dopant. This is mostly likely a result of the low dopant concentration in all cases (i.e., less than 1%), which does not impede charge flow, and the similar lowest unoccupied molecular orbital (LUMO) for all dopants, so that there is no barrier to charge movement with any red dopant.
Figure 6.J-V characteristics of white PHOLEDs with different red phosphorescent dopants: (a) A1–A4, (b) B1–B4, (c) C1–C4, and (d) optimized devices A3, B2, and C4.
In conclusion, we analyze the performances of three primary color single emissive white PHOLEDs containing , , and as red phosphorescent dopants. It is found that the efficiency and CRI of the devices are closely related to location of the wavelength in the emission spectrum and the absorption properties of each color dopant. The single emissive white PHOLED B2 [containing ] has a maximum luminous efficiency of 17.2 cd/A and a CRI of 72.9, and color coordinates of (0.367, 0.402) at 10 V. Such a device has a higher luminous efficiency and CRI due to a greater emission in the green region of the wavelength spectrum and a longer extended MLCT emission that overlaps with the green dopant emission, optimizing energy transfer among the three dopants. Though the green dopant does not contribute directly to the emission spectrum, the transfer of energy to the red dopant leads to a greater overall emission intensity.
References
[1] J. Kido, M. Kimura, K. Nagai. Science, 267, 1332(1995).
[2] M. A. Baldo, D. F. O’Brien, Y. You, A. Shoustikov, S. Sibley, M. E. Thompson, S. R. Forrest. Nature, 395, 151(1998).
[3] M. A. Baldo, S. Lamansky, P. E. Burrows, M. E. Thompson, S. R. Forrest. Appl. Phys. Lett., 75, 4(1999).
[4] C. Adachi, M. A. Baldo, M. E. Thompson, S. R. Forrest. J. Appl. Phys., 90, 5048(2001).
[5] B. W. D’Andrade, S. R. Forrest. Adv. Mater., 16, 1585(2004).
[6] R. F. Service. Science, 310, 1762(2005).
[7] H. Uoyama, K. Goushi, K. Shizu, H. Nomura, C. Adachi. Nature, 492, 234(2012).
[8] C. J. Chiang, A. Kimyonok, M. K. Etherington, G. C. Griffiths, V. Jankus, F. Turksoy, A. P. Monkman. Adv. Funct. Mater., 23, 739(2013).
[9] Q. Zhang, B. Li, S. Huang, H. Nomura, H. Tanaka, C. Adachi. Nat. Photon., 8, 326(2014).
[10] C. Adachi, M. A. Baldo, S. R. Forrest, M. E. Thompson. Appl. Phys. Lett., 77, 904(2000).
[11] C. Adachi, M. A. Baldo, S. R. Forrest, S. Lamansky, M. E. Thompson, R. C. Kwong. Appl. Phys. Lett., 78, 1622(2001).
[12] C. Adachi, R. C. Swong, P. Djurovich, V. Adamovich, M. A. Baldo, M. E. Thompson, S. R. Forrest. Appl. Phys. Lett., 79, 2082(2001).
[13] Y. Sun, N. C. Giebink, H. Kanno, B. Ma, M. E. Thompson, S. R. Forrest. Nature, 440, 908(2006).
[14] J. H. Seo, I. H. Park, G. Y. Kim, K. H. Lee, M. K. Kim, S. S. Yoon, Y. K. Kim. Appl. Phys. Lett., 92, 183303(2008).
[15] U. S. Bhansali, H. Jia, M. A. Q. Lopez, B. E. Gnade, W. H. Chen, M. A. Omary. Appl. Phys. Lett., 94, 203501(2009).
[16] C. Weichsel, S. Reineke, M. Furno, B. Lussem, K. Leo. Appl. Phys. Lett., 111, 033102(2012).
[17] B. Zhao, Z. Su, W. Li, B. Chu, F. Jin, X. Yan, T. Zhang, F. Zhang, D. Fan, Y. Gao, J. Wang, H. Pi, J. Zhu. Nanoscale Res. Lett., 8, 529(2013).
[18] N. Sun, Q. Wang, Y. Zhao, Y. Chen, D. Yang, F. Zhao, J. Chen, D. Ma. Adv. Mater., 26, 1617(2014).
[19] W. S. Jeon, T. J. Park, S. Y. Kim, R. Pode, J. Jang, J. H. Kwon. Org. Electron., 10, 240(2009).
[20] M. C. Suh, H. Y. Shin, S. J. Cha. Org. Electron., 14, 2198(2013).
[21] T. Forster. Discuss. Faraday Soc., 27, 7(1959).
[22] D. L. Dexter. J. Chem. Phys., 21, 836(1953).