• Photonics Research
  • Vol. 10, Issue 5, 1255 (2022)
Jiazhen Zhai1、†, Ruheng Shi1、†, and Lingjie Kong1、2、*
Author Affiliations
  • 1State Key Laboratory of Precision Measurement Technology and Instruments, Department of Precision Instrument, Tsinghua University, Beijing 100084, China
  • 2IDG/McGovern Institute for Brain Research, Tsinghua University, Beijing 100084, China
  • show less
    DOI: 10.1364/PRJ.451895 Cite this Article Set citation alerts
    Jiazhen Zhai, Ruheng Shi, Lingjie Kong. Improving signal-to-background ratio by orders of magnitude in high-speed volumetric imaging in vivo by robust Fourier light field microscopy[J]. Photonics Research, 2022, 10(5): 1255 Copy Citation Text show less
    System scheme of RFLFM. EF1, excitation filter 1; TIR, total internal reflection prism; DMD, deformable mirror device; RL, relay lens; DM, dichroic mirror; RM, reflector mirror; TL, tube lens; EF2, emission filter 2; FL, Fourier lens; MLA, microlens array. A DMD is used in the illumination path to project the uniform and structured illumination patterns, and a TIR is used to separate the incident beam and reflected beam on the DMD. The camera exposure is synchronized with each illumination pattern by the computer. A conventional FLFM imaging path is built to record images at different views. The inset shows the distribution of spatial frequency domain on the MLA.
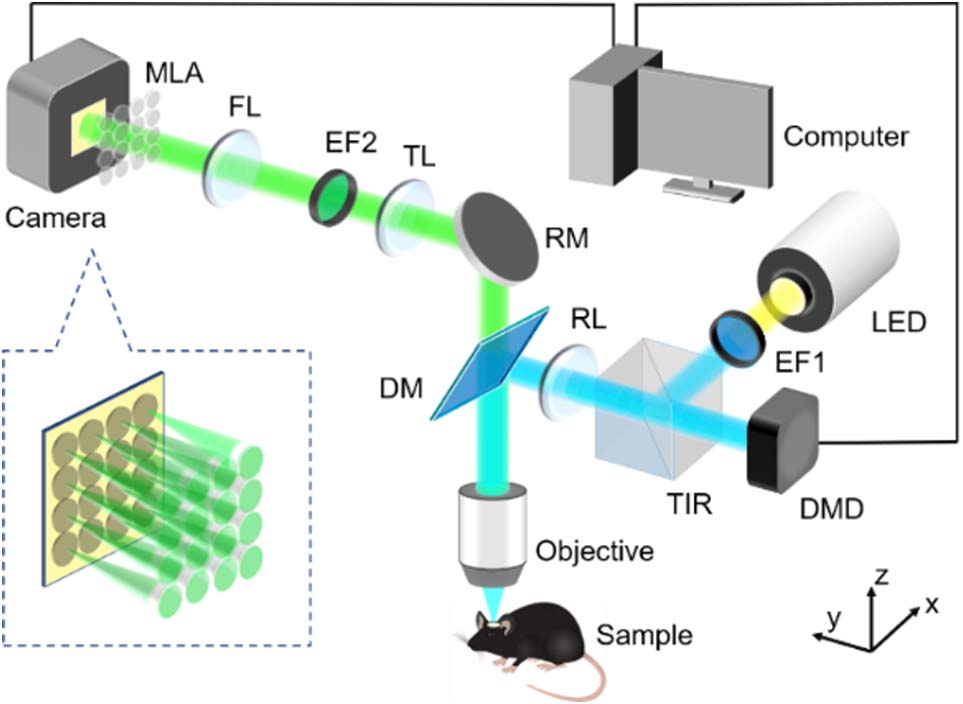
    Fig. 1. System scheme of RFLFM. EF1, excitation filter 1; TIR, total internal reflection prism; DMD, deformable mirror device; RL, relay lens; DM, dichroic mirror; RM, reflector mirror; TL, tube lens; EF2, emission filter 2; FL, Fourier lens; MLA, microlens array. A DMD is used in the illumination path to project the uniform and structured illumination patterns, and a TIR is used to separate the incident beam and reflected beam on the DMD. The camera exposure is synchronized with each illumination pattern by the computer. A conventional FLFM imaging path is built to record images at different views. The inset shows the distribution of spatial frequency domain on the MLA.
    High-contrast volumetric imaging of neural network activity in the brains of larval zebrafish in vivo. The imaging depth is centered at about tens of microns below the brain surface of the zebrafish. (a) and (b) Maximum intensity projects (MIPs) over recording time in the 4D (x–y–z–t) domain, captured by RFLFM and FLFM modes, respectively. Scale bar: 150 μm. (c) Fluorescence signals of neurons, based on RFLFM reconstructed images. The activity shows a visible increase at about 57 s and 75 s. (d) 3D projection of (a) in different orthogonal planes. Scale bar: 60 μm. (g) 3D projection of (b) in different orthogonal planes. Scale bar: 60 μm. (e) and (f) Zoom-in views of the regions in boxes of (d) and (g), respectively. Scale bar: 20 μm. (h) Zoom-in view of orange box indicating the activity of 60 neurons in (c). (i)–(l) Zoom-in views of the regions in boxes of (e) and (f), where the arrows indicate the neurons. Scale bar: 10 μm. (m) Calcium tracings of five neurons, indicated in (i)–(l). The orange line indicates signals achieved in RFLFM and the blue line indicates signals enlarged three times achieved in FLFM.
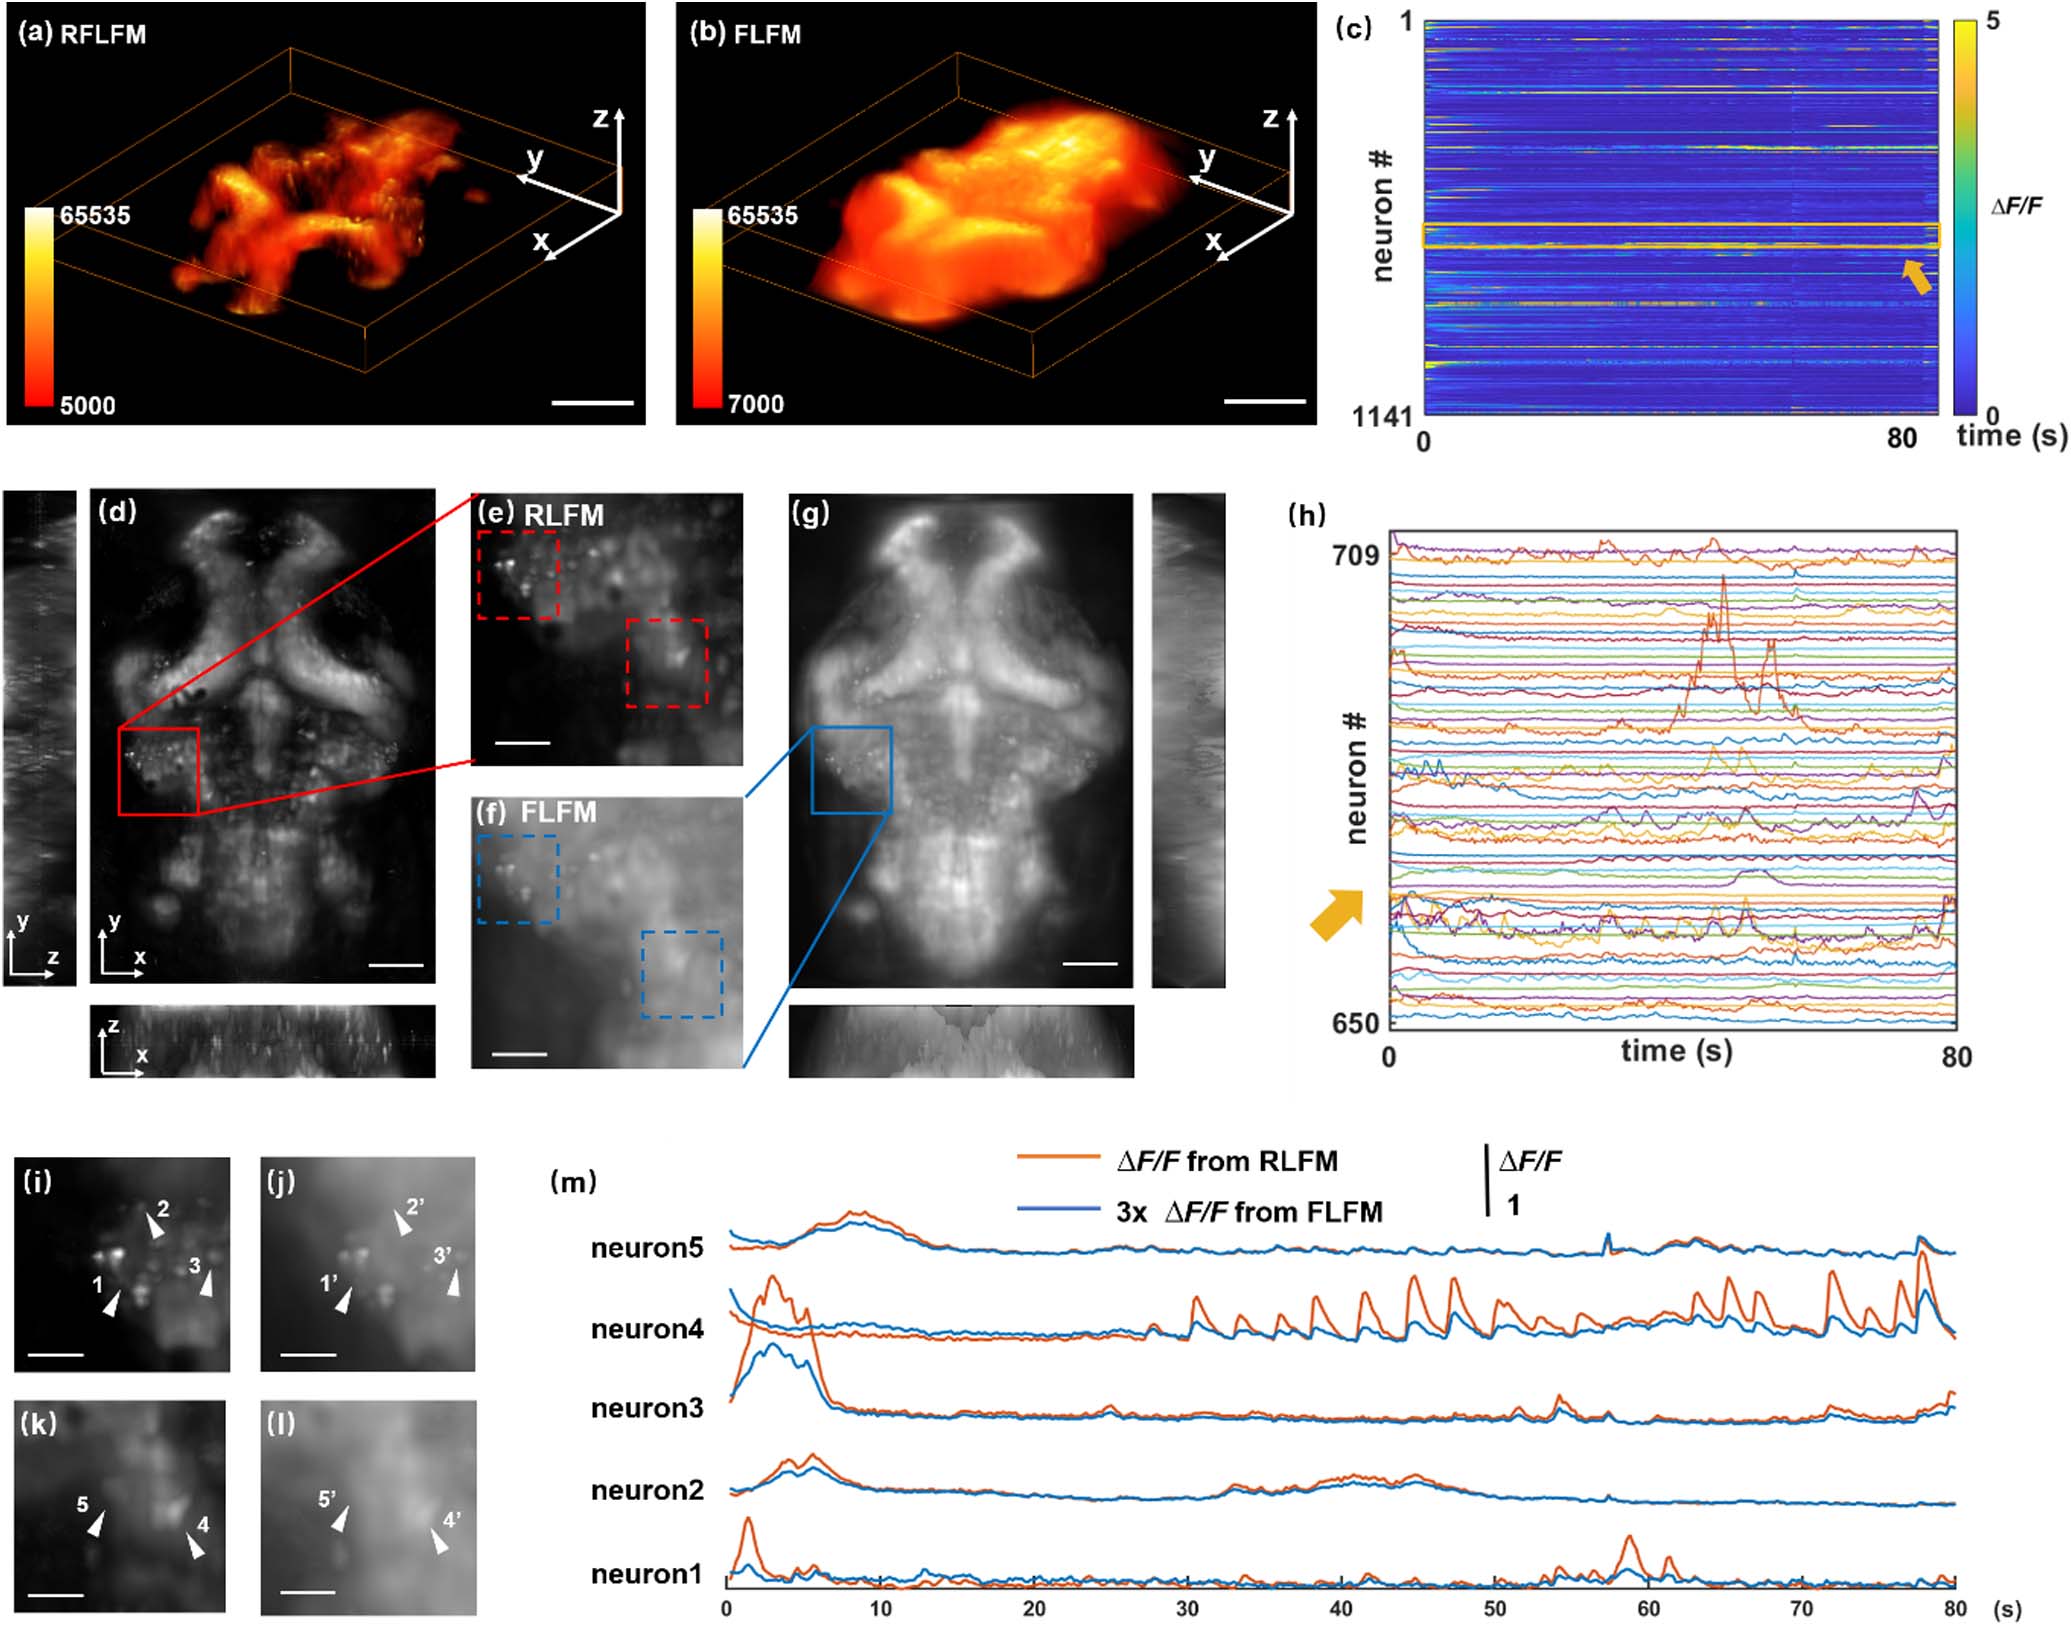
    Fig. 2. High-contrast volumetric imaging of neural network activity in the brains of larval zebrafish in vivo. The imaging depth is centered at about tens of microns below the brain surface of the zebrafish. (a) and (b) Maximum intensity projects (MIPs) over recording time in the 4D (xyzt) domain, captured by RFLFM and FLFM modes, respectively. Scale bar: 150 μm. (c) Fluorescence signals of neurons, based on RFLFM reconstructed images. The activity shows a visible increase at about 57 s and 75 s. (d) 3D projection of (a) in different orthogonal planes. Scale bar: 60 μm. (g) 3D projection of (b) in different orthogonal planes. Scale bar: 60 μm. (e) and (f) Zoom-in views of the regions in boxes of (d) and (g), respectively. Scale bar: 20 μm. (h) Zoom-in view of orange box indicating the activity of 60 neurons in (c). (i)–(l) Zoom-in views of the regions in boxes of (e) and (f), where the arrows indicate the neurons. Scale bar: 10 μm. (m) Calcium tracings of five neurons, indicated in (i)–(l). The orange line indicates signals achieved in RFLFM and the blue line indicates signals enlarged three times achieved in FLFM.
    High-contrast fast volumetric imaging of heart beating in larval zebrafish in vivo. The imaging depth is centered at about tens of microns below the body surface of the zebrafish. (a) and (b) Volumetric imaging of heart beating at t=0.3 s, captured by RFLFM and FLFM, respectively. Scale bar: 50 μm. (c) Intensity distribution in blue boxes in (a) and (b), respectively. (d) 3D trajectory of a single blood cell in the heart of a larval zebrafish. (e) Tracing of the blood cell in (d) at different time points. Red circles indicate the blood cell. See also in Visualization 2.
    Fig. 3. High-contrast fast volumetric imaging of heart beating in larval zebrafish in vivo. The imaging depth is centered at about tens of microns below the body surface of the zebrafish. (a) and (b) Volumetric imaging of heart beating at t=0.3  s, captured by RFLFM and FLFM, respectively. Scale bar: 50 μm. (c) Intensity distribution in blue boxes in (a) and (b), respectively. (d) 3D trajectory of a single blood cell in the heart of a larval zebrafish. (e) Tracing of the blood cell in (d) at different time points. Red circles indicate the blood cell. See also in Visualization 2.
    High-contrast volumetric imaging of vascular dilations in mouse cerebral cortex in vivo. The imaging depth is centered at about tens of microns below the cortical surface of mouse brains. (a) and (b) Volumetric images of blood vessels achieved by RFLFM and FLFM, respectively. Color coded depth: [−45,45] μm. Scale bar: 100 μm. (c) Enlarged ROIs in boxes 1–3 in (a), respectively. All images are normalized to themselves. Depths of ROIs: ROI 1 at 22.5 μm, ROI 2 at 0 μm, ROI 3 at 36 μm, respectively. (d) Dilations of blood vessels shown in ROIs 1–3, respectively. See also Visualization 3.
    Fig. 4. High-contrast volumetric imaging of vascular dilations in mouse cerebral cortex in vivo. The imaging depth is centered at about tens of microns below the cortical surface of mouse brains. (a) and (b) Volumetric images of blood vessels achieved by RFLFM and FLFM, respectively. Color coded depth: [45,45]  μm. Scale bar: 100 μm. (c) Enlarged ROIs in boxes 1–3 in (a), respectively. All images are normalized to themselves. Depths of ROIs: ROI 1 at 22.5 μm, ROI 2 at 0 μm, ROI 3 at 36 μm, respectively. (d) Dilations of blood vessels shown in ROIs 1–3, respectively. See also Visualization 3.
    High-contrast volumetric imaging of neuronal network activity in mouse cerebral cortex in vivo. The imaging depth is centered at about 150–200 μm below the cortical surface of the mouse brains. (a) and (b) MIPs over time in 4D domain (x–y–z–t), processed by RFLFM and FLFM, respectively. Scale bar: 180 μm. (c) 3D positions of post-extracted neurons. (d) and (f) Neuronal network activity based on RFLFM and FLFM, respectively. Volumetric rate in RFLFM: 2.5 Hz. (e) Activity traces of selected neurons in (c) (labeled in red). The orange lines show the RFLFM processed results, and the blue lines are the FLFM processed results enlarged 10 times. The order of each neuron is indicated in the left column. (g) and (h) Traces for the selected 20 neurons in (d) labeled yellow box and (f) labeled red box. Also see Visualization 4.
    Fig. 5. High-contrast volumetric imaging of neuronal network activity in mouse cerebral cortex in vivo. The imaging depth is centered at about 150–200 μm below the cortical surface of the mouse brains. (a) and (b) MIPs over time in 4D domain (xyzt), processed by RFLFM and FLFM, respectively. Scale bar: 180 μm. (c) 3D positions of post-extracted neurons. (d) and (f) Neuronal network activity based on RFLFM and FLFM, respectively. Volumetric rate in RFLFM: 2.5 Hz. (e) Activity traces of selected neurons in (c) (labeled in red). The orange lines show the RFLFM processed results, and the blue lines are the FLFM processed results enlarged 10 times. The order of each neuron is indicated in the left column. (g) and (h) Traces for the selected 20 neurons in (d) labeled yellow box and (f) labeled red box. Also see Visualization 4.
    Jiazhen Zhai, Ruheng Shi, Lingjie Kong. Improving signal-to-background ratio by orders of magnitude in high-speed volumetric imaging in vivo by robust Fourier light field microscopy[J]. Photonics Research, 2022, 10(5): 1255
    Download Citation