
Jiazhen Zhai, Ruheng Shi, Lingjie Kong, "Improving signal-to-background ratio by orders of magnitude in high-speed volumetric imaging in vivo by robust Fourier light field microscopy," Photonics Res. 10, 1255 (2022)
- Photonics Research
- Vol. 10, Issue 5, 1255 (2022)
Abstract
1. INTRODUCTION
Benefiting from the capability of high-speed volumetric imaging, light field microscopy (LFM) [1] has found various applications in biomedical study in vivo, including fast functional imaging [2,3] and structural imaging [4,5]. However, the cost of volumetric imaging under a single exposure in LFM is low spatial resolution. LFM also is susceptible to reconstruction artifacts [6–8].
Instead, Fourier light field microscopy (FLFM) is proposed [9–11], in which a lens is added to transform the native image to the Fourier domain on its back focal plane and the microlens array (MLA) is placed there to collect multi-view images. Compared to LFM, FLFM has the advantage of a uniform point spread function (PSF) across the field of view (FOV), which can remove reconstruction artifacts during deconvolution, achieving high optical resolution and high localization precision [12–14]. In addition, the multi-angle projection method is also proposed to achieve full NA volumetric imaging, which is similar to FLFM, but has a lower imaging rate [15]. However, the issue of an intense background still exists in FLFM, which is also an issue in LFM. Considering that it inherits the conventional wide-field illumination strategy, the background in FLFM images is mainly caused by the excited signals from out of depth-of-field (DOF) and the tissue scattered emission light [16,17], which leads to poor contrast and unexcepted artifacts in practical imaging.
To minimize the background for quantitative imaging in either LFM or FLFM, the computational LFM method [18], speckle illumination [19], light sheet illumination [20–23], two-photon illumination [24], and confocal detection [25] are employed and all achieved excellent performances. However, these methods either require prior assumptions, restrict the sample size, or are not flexible for various applications. Moreover, selective-volume illumination methods [15] such as the light sheet illumination method fail in resisting the background from tissue scattering.
Sign up for Photonics Research TOC. Get the latest issue of Photonics Research delivered right to you!Sign up now
Here, we propose what we believe, to the best of our knowledge, is a novel approach called robust Fourier light field microscopy (RFLFM) to achieve robust, high-speed, high-contrast volumetric imaging by removing the background signal based on structured illumination [26–31] and computational reconstruction. Different from conventional FLFM, we use structured illumination and uniform illumination to sequentially modulate the designed DOF region. Then, the captured raw images are segmented and processed with HiLo algorithm [29] to subtract background information, which can improve the image contrast significantly and help to avoid artifacts induced by background fluctuations. After that, a high-quality and robust volumetric image can be reconstructed based on deconvolution as in conventional FLFM [25]. To demonstrate the superior performance of our technique, we perform both structural imaging and functional imaging in larval zebrafish and mouse in vivo, at volumetric imaging rate up to 33.3 Hz. Based on the statistic results, the signal-to-background ratio (SBR) can be improved by orders of magnitude, while the whole image contrast is improved by as much as
2. SYSTEM DESIGN
The main principle of RFLFM is employing structure illumination and computational reconstruction based on HiLo algorithm in FLFM to achieve background-robust imaging, as described in Supplementary Note 1 in Ref. [32].
Figure 1 shows the schematic layout of the RFLFM system. We use a collimated LED light (120LED X-Cite) as the light source, and an excitation bandpass filter (EF1, MF469-35, Thorlabs) to select
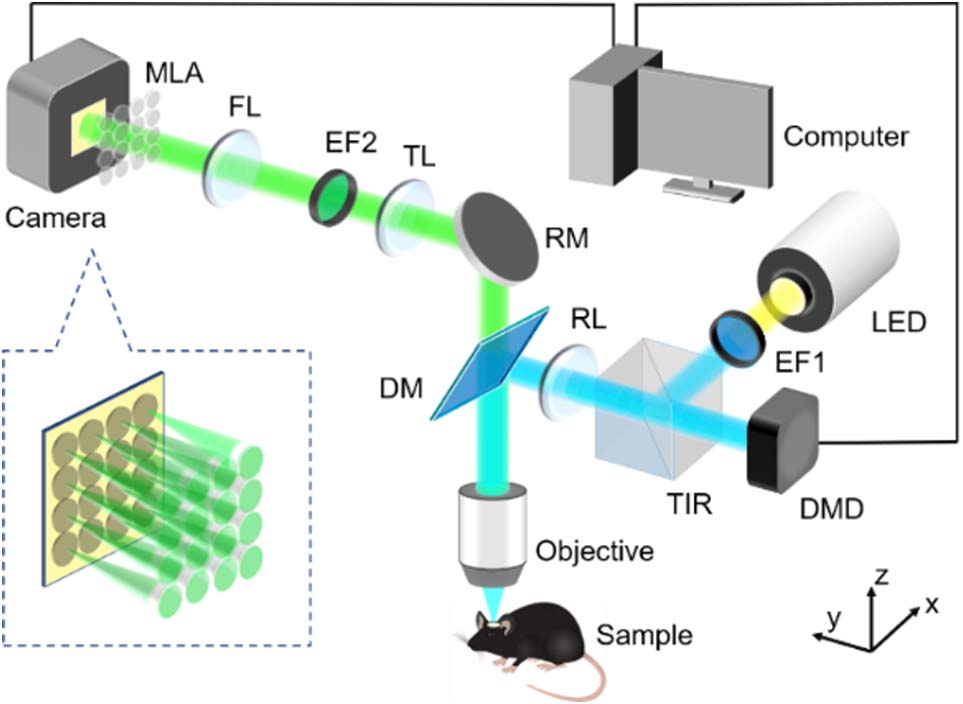
Figure 1.System scheme of RFLFM. EF1, excitation filter 1; TIR, total internal reflection prism; DMD, deformable mirror device; RL, relay lens; DM, dichroic mirror; RM, reflector mirror; TL, tube lens; EF2, emission filter 2; FL, Fourier lens; MLA, microlens array. A DMD is used in the illumination path to project the uniform and structured illumination patterns, and a TIR is used to separate the incident beam and reflected beam on the DMD. The camera exposure is synchronized with each illumination pattern by the computer. A conventional FLFM imaging path is built to record images at different views. The inset shows the distribution of spatial frequency domain on the MLA.
Based on the optical design above, the DMD is demagnified 13.89 times to
3. EXPERIMENTAL RESULTS
All procedures involving animals are approved by the Animal Care and Use Committees of Tsinghua University.
A. High-Contrast Volumetric Imaging of Vascular Structure in the Brains of Larval Zebrafish in vivo
Imaging of vascular morphology and structure in larval zebrafish is a very attractive subject of clinical interests [35]. To demonstrate our advantage in high-contrast volumetric imaging, we perform imaging of the vascular structure in the brains of larval zebrafish in vivo. We use Tg (fli1a:GFP) zebrafish at 5–7 days’ post fertilization, and embed them in 1% agarose during imaging.
We reconstruct a volume of
B. High-Contrast Volumetric Imaging of Neuronal Network Activity in the Brains of Larval Zebrafish in vivo
LFM is good for high-speed volumetric imaging of biodynamics. To demonstrate the advantage of our RFLFM in high-contrast volumetric imaging at a sub-cellular resolution, we perform calcium imaging of neural network activity in the brains of larval zebrafish in vivo. We use Tg (HUC:H2B-GCaMP6f) zebrafish at 5–7 days’ post fertilization, and embed them in 1% agarose during imaging. We perform volumetric imaging over a 90 μm depth range, and set the acquisition time for each volume as 100 ms (exposure time: 90 ms), corresponding to a volume rate of 5 Hz in RFLFM mode.
To demonstrate the superiority of RFLFM in depressing the background signals, we compare the performance of RFLFM and conventional FLFM. We reconstruct a volume of
![]()
Figure 2.High-contrast volumetric imaging of neural network activity in the brains of larval zebrafish
To quantitatively show the optical-sectioning capability and its robustness to scattering-induced cross-talk, we compare the fluorescence dynamics (
Furthermore, we show the statistical SBR of all the 1141 neurons in both RFLFM and FLFM modes (Appendix C, Fig. S6 in Ref. [32]). The results show the median value of the SBR improvement is 15.5, which suggests a remarkable advance. For comparison, we show the reconstructed results of the flashing neurons in Fig. S7 in Ref. [32] (see also Fig. S8 in Ref. [32] and
C. High-Speed, High-Contrast Volumetric Imaging of Heart-Beating Dynamics in Larval Zebrafish in vivo
Imaging of fast dynamics in 3D is challenging, considering the volumetric imaging speed is always limited. Here, we perform imaging of hearts beating in larval zebrafish to demonstrate that our RFLFM is competent for high-contrast fast volumetric imaging. We use runx1:GFP zebrafish (labeling the hematopoietic stem cells) at 2–4 days’ post fertilization as samples, and embed them in 1% agarose during imaging.
To capture the flow of blood cells in the hearts, we perform imaging at 66.7 Hz (33.3 Hz in RFLFM mode; see also Fig. S9 in Ref. [32] and
![]()
Figure 3.High-contrast fast volumetric imaging of heart beating in larval zebrafish
D. High-Contrast Volumetric Imaging of Vascular Dilations in Mouse Brains in vivo
To show the capability of RFLFM in high-contrast volumetric imaging in more turbid tissues, we also perform structural imaging in mouse brains in vivo. We use adult C57BL/6 mice and perform craniotomy for chronic imaging. After 2–4 weeks, we inject FITC (70,000 MW, Sigma-Aldrich, MilliporeSigma) into the blood vessels (2%
The volumetric images of blood vessels achieved by RFLFM and FLFM are shown in Figs. 4(a) and 4(b), respectively. It can be seen that the image contrast is improved significantly in RFLFM. We highlight three ROIs (noted as 1–3 and
![]()
Figure 4.High-contrast volumetric imaging of vascular dilations in mouse cerebral cortex
We perform volumetric imaging of vascular networks at 5 Hz. The diameters of the dilation of blood vessels, as shown in Fig. 4(c) (diameters of the blood vessels are measured using the plugin DiameterJ in ImageJ), agree with the neurovascular coupling hypothesis [39–41]. From Fig. 4(d), we can see that the three selected vessels dilate with similar traces (also see Fig. S11 in Ref. [32] and
E. High-Contrast Robust Volumetric Imaging of Neuronal Network Activity in Mouse Brains in vivo
Functional imaging of neuronal network activity in mouse brains is challenging for conventional single-photon imaging techniques because it suffers from low contrast led by strong tissue scattering [3,18]. In addition, the original signal of neuronal activity may be easily overwhelmed by global and/or local background fluctuations, which causes unexcepted artifacts. Here, we employ RFLFM in high-contrast robust volumetric functional imaging in mouse brains in vivo.
We use adult Rasgrf-dCre: Ai148 mice with GCaMP-6f expressing in cortical layers 2/3 as samples and perform craniotomy for chronic imaging. After two weeks to recuperate, we perform calcium imaging when the mice are awake and head-restrained under the microscope. We reconstruct a volume of
![]()
Figure 5.High-contrast volumetric imaging of neuronal network activity in mouse cerebral cortex
For further comparison, we indicate two background-induced artifacts at different moments by red and green arrows, and show the temporal traces of 20 neurons (Nos. #41–#60) in these time intervals [labeled by orange box in Fig. 5(d) and red box in Fig. 5(f), respectively] in Figs. 5(g) and 5(h), corresponding, respectively, to the RFLFM and FLFM modes. In Fig. 5(h), all neurons exhibit similar temporal trace moments indicated by the red and green backgrounds. In contrast, the neurons show independent activities in Fig. 5(g). We also analyze the relationship between background fluctuations and neuronal signals in FLFM and RFLFM, as shown by Fig. S16 in Ref. [32]. We choose two neurons (#2 and #40) as examples, and get the difference between their temporal traces in the two modes, as shown in Figs. S16(a), S16(b) and S16(d) in Ref. [32], by subtracting the normalized intensity. As neuronal activity is temporally sparse, we average the whole FOV pixels in FLFM results as the background for each frame to get an approximate background fluctuation in FLFM, as shown in Fig. S16(c) in Ref. [32]. The background fluctuation shows a high correlation with the difference of neuronal signals between FLFM and RFLFM, which strongly suggests that RFLFM can eliminate the background fluctuation-induced artifacts, but preserve the original neural activity signals.
4. DISCUSSION AND CONCLUSIONS
By introducing the structured illumination and computational sectioning algorithm, we propose RFLFM for robust, high-speed, high-contrast volumetric imaging
To summarize, we experimentally build an RFLFM system with 2.5–4 μm lateral resolution and 5–9 μm axial resolution in an
Acknowledgment
Acknowledgment. Authors Jiazhen Zhai and Ruheng Shi thank Zheng Jiang and Kuikui Fan for helping with the experimental animal preparation. Lingjie Kong thanks Tsinghua University for its support.
APPENDIX A: SYSTEM CALIBRATION
To calibrate the optical resolution experimentally, we use
Furthermore, we analyze the system aberrations with Zemax simulations based on ray tracing (Fig. S22 in Ref. [
APPENDIX B: DATA PROCESSING
The procedure of image reconstruction in RFLFM is shown in Fig. S3 in Ref. [
APPENDIX C: PERFORMANCE METRICS
Image contrast
In this paper, the SBR is used to measure the signal gains in a small area (like a neuron). It is defined as
The background intensity
We use the Pearson coefficient to study whether the
References
[1] M. Levoy, R. Ng, A. Adams, M. Footer, M. Horowitz. Light field microscopy. ACM Trans. Graph., 25, 924-934(2006).
[2] R. Prevedel, Y. G. Yoon, M. Hoffmann, N. Pak, G. Wetzstein, S. Kato, T. Schrodel, R. Raskar, M. Zimmer, E. S. Boyden, A. Vaziri. Simultaneous whole-animal 3D imaging of neuronal activity using light-field microscopy. Nat. Methods, 11, 727-730(2014).
[3] T. Nobauer, O. Skocek, A. J. Pernia-Andrade, L. Weilguny, F. M. Traub, M. I. Molodtsov, A. Vaziri. Video rate volumetric Ca2+ imaging across cortex using seeded iterative demixing (SID) microscopy. Nat. Methods, 14, 811-818(2017).
[4] J. Wu, Z. Lu, D. Jiang, Y. Guo, H. Qiao, Y. Zhang, T. Zhu, Y. Cai, X. Zhang, K. Zhanghao, H. Xie, T. Yan, G. Zhang, X. Li, Z. Jiang, X. Lin, L. Fang, B. Zhou, P. Xi, J. Fan, L. Yu, Q. Dai. Iterative tomography with digital adaptive optics permits hour-long intravital observation of 3D subcellular dynamics at millisecond scale. Cell, 184, 3318-3332(2021).
[5] H. Li, C. Guo, D. Kim-Holzapfel, W. Li, Y. Altshuller, B. Schroeder, W. Liu, Y. Meng, J. B. French, K. I. Takamaru, M. A. Frohman, S. Jia. Fast, volumetric live-cell imaging using high-resolution light-field microscopy. Biomed. Opt. Express, 10, 29-49(2019).
[6] M. Broxton, L. Grosenick, S. Yang, N. Cohen, A. Andalman, K. Deisseroth, M. Levoy. Wave optics theory and 3-D deconvolution for the light field microscope. Opt. Express, 21, 25418-25439(2013).
[7] N. Wagner, F. Beuttenmueller, N. Norlin, J. Gierten, J. C. Boffi, J. Wittbrodt, M. Weigert, L. Hufnagel, R. Prevedel, A. Kreshuk. Deep learning-enhanced light-field imaging with continuous validation. Nat. Methods, 18, 557-563(2021).
[8] Y. Zhang, B. Xiong, Y. Zhang, Z. Lu, J. Wu, Q. Dai. DiLFM: an artifact-suppressed and noise-robust light-field microscopy through dictionary learning. Light Sci. Appl., 10, 152(2021).
[9] C. Guo, W. Liu, X. Hua, H. Li, S. Jia. Fourier light-field microscopy. Opt. Express, 27, 25573-25594(2019).
[10] A. Llavador, J. Sola-Pikabea, G. Saavedra, B. Javidi, M. Martinez-Corral. Resolution improvements in integral microscopy with Fourier plane recording. Opt. Express, 24, 20792-20798(2016).
[11] Y. Xue, G. D. Ian, A. B. David, L. Tian. Single-shot 3D wide-field fluorescence imaging with a Computational Miniature Mesoscope. Sci. Adv., 6, eabb7508(2020).
[12] X. Hua, W. Liu, S. Jia. High-resolution Fourier light-field microscopy for volumetric multi-color live-cell imaging. Optica, 8, 614-620(2021).
[13] L. Cong, Z. Wang, Y. Chai, W. Hang, C. Shang, W. Yang, L. Bai, J. Du, K. Wang, Q. Wen. Rapid whole brain imaging of neural activity in freely behaving larval zebrafish (
[14] R. R. Sims, S. A. Rehman, M. O. Lenz, S. I. Benaissa, E. Bruggeman, A. Clark, E. W. Sanders, A. Ponjavic, L. Muresan, S. F. Lee, K. O’Holleran. Single molecule light field microscopy. Optica, 7, 1065-1072(2020).
[15] B. J. Chang, J. D. Manton, E. Sapoznik, T. Pohlkamp, T. S. Terrones, E. S. Welf, V. S. Murali, P. Roudot, K. Hake, L. Whitehead, A. G. York, K. M. Dean, R. Fiolka. Real-time multi-angle projection imaging of biological dynamics. Nat. Methods, 18, 829-834(2021).
[16] J. Mertz. Optical sectioning microscopy with planar or structured illumination. Nat. Methods, 8, 811-819(2011).
[17] V. Ntziachristos. Going deeper than microscopy: the optical imaging frontier in biology. Nat. Methods, 7, 603-614(2010).
[18] Y. Zhang, Z. Lu, J. Wu, X. Lin, D. Jiang, Y. Cai, J. Xie, Y. Wang, T. Zhu, X. Ji, Q. Dai. Computational optical sectioning with an incoherent multiscale scattering model for light-field microscopy. Nat. Commun., 12, 6391(2021).
[19] M. A. Taylor, T. Nöbauer, A. Pernia-Andrade, F. Schlumm, A. Vaziri. Brain-wide 3D light-field imaging of neuronal activity with speckle-enhanced resolution. Optica, 5, 345-353(2018).
[20] N. Wagner, N. Norlin, J. Gierten, G. de Medeiros, B. Balázs, J. Wittbrodt, L. Hufnagel, R. Prevedel. Instantaneous isotropic volumetric imaging of fast biological processes. Nat. Methods, 16, 497-500(2019).
[21] D. Wang, S. Xu, P. Pant, E. Redington, S. Soltanian-Zadeh, S. Farsiu, Y. Gong. Hybrid light-sheet and light-field microscope for high resolution and large volume neuroimaging. Biomed. Opt. Express, 10, 6595-6610(2019).
[22] Y.-G. Yoon, Z. Wang, N. Pak, D. Park, P. Dai, J. S. Kang, H.-J. Suk, P. Symvoulidis, B. Guner-Ataman, K. Wang, E. S. Boyden. Sparse decomposition light-field microscopy for high speed imaging of neuronal activity. Optica, 7, 1457-1468(2020).
[23] Z. Fu, Q. Geng, J. Chen, L. A. Chu, A. S. Chiang, S. C. Chen. Light field microscopy based on structured light illumination. Opt. Lett., 46, 3424-3427(2021).
[24] S. Madaan, K. Keomanee-Dizon, M. Jones, C. Zhong, A. Nadtochiy, P. Luu, S. E. Fraser, T. V. Truong. Single-objective selective-volume illumination microscopy enables high-contrast light-field imaging. Opt. Lett., 46, 2860-2863(2021).
[25] Z. Zhang, L. Bai, L. Cong, P. Yu, T. Zhang, W. Shi, F. Li, J. Du, K. Wang. Imaging volumetric dynamics at high speed in mouse and zebrafish brain with confocal light field microscopy. Nat. Biotechnol., 39, 74-83(2021).
[26] N. Bozinovic, C. Ventalon, T. Ford, J. Mertz. Fluorescence endomicroscopy with structured illumination. Opt. Express, 16, 8016-8025(2008).
[27] S. Santos, K. K. Chu, D. Lim, N. Bozinovic, T. N. Ford, C. Hourtoule, A. C. Bartoo, S. K. Singh, J. Mertz. Optically sectioned fluorescence endomicroscopy with hybrid-illumination imaging through a flexible fiber bundle. J. Biomed. Opt., 14, 030502(2009).
[28] D. Lim, K. K. Chu, J. Mertz. Wide-field fluorescence sectioning with hybrid speckle and uniform-illumination microscopy. Opt. Lett., 33, 1819-1821(2008).
[29] D. Lim, T. Ford, K. Chu, J. Mertz. Optically sectioned
[30] Q. Zhang, D. Pan, N. Ji. High-resolution
[31] T. N. Ford, D. Lim, J. Mertz. Fast optically sectioned fluorescence HiLo endomicroscopy. J. Biomed. Opt., 17, 021105(2012).
[32] J. Zhai, R. Shi, L. Kong. RFLFM supplementary information.
[33] D. Dan, M. Lei, B. Yao, W. Wang, M. Winterhalder, A. Zumbusch, Y. Qi, L. Xia, S. Yan, Y. Yang, P. Gao, T. Ye, W. Zhao. DMD-based LED-illumination super-resolution and optical sectioning microscopy. Sci. Rep., 3, 1116(2013).
[34] R. Shi, L. Kong. Evaluating structured-illumination patterns in optimizing optical-sectioning of HiLo microscopy. J. Phys. D, 54, 414001(2021).
[35] H. W. Detrich, H. M. Jung, S. Isogai, M. Westerfield, M. Kamei, L. I. Zon, D. Castranova, A. V. Gore, B. M. Weinstein. Chapter 4 - Imaging blood vessels and lymphatic vessels in the zebrafish. Methods in Cell Biology, 69-103(2016).
[36] P. Zhou, S. L. Resendez, J. Rodriguez-Romaguera, J. C. Jimenez, S. Q. Neufeld, A. Giovannucci, J. Friedrich, E. A. Pnevmatikakis, G. D. Stuber, R. Hen, M. A. Kheirbek, B. L. Sabatini, R. E. Kass, L. Paninski. Efficient and accurate extraction of
[37] E. Yoshida, S. I. Terada, Y. H. Tanaka, K. Kobayashi, M. Ohkura, J. Nakai, M. Matsuzaki.
[38] F. Appaix, S. Girod, S. Boisseau, J. Römer, J.-C. Vial, M. Albrieux, M. Maurin, A. Depaulis, I. Guillemain, B. van der Sanden. Specific
[39] H. Girouard, C. Iadecola. Neurovascular coupling in the normal brain and in hypertension, stroke, and Alzheimer disease. J. Appl. Physiol., 100, 328-335(2006).
[40] J. H. Park, L. Kong, Y. Zhou, M. Cui. Large-field-of-view imaging by multi-pupil adaptive optics. Nat. Methods, 14, 581-583(2017).
[41] J. L. Fan, J. A. Rivera, W. Sun, J. Peterson, H. Haeberle, S. Rubin, N. Ji. High-speed volumetric two-photon fluorescence imaging of neurovascular dynamics. Nat. Commun., 11, 6020(2020).
[42] D. Dana, M. D. Walter, S. John. Emerging digital micromirror device (DMD) applications. Proc. SPIE, 4985, 14-25(2003).
[43] D. H. Kim, J. Kim, J. C. Marques, A. Grama, D. G. C. Hildebrand, W. Gu, J. M. Li, D. N. Robson. Pan-neuronal calcium imaging with cellular resolution in freely swimming zebrafish. Nat. Methods, 14, 1107-1114(2017).
[44] R. Shi, C. Jin, H. Xie, Y. Zhang, X. Li, Q. Dai, L. Kong. Multi-plane, wide-field fluorescent microscopy for biodynamic imaging


Set citation alerts for the article
Please enter your email address

© Copyright 2018-2021 | Chinese Laser Press. All Rights Reserved 沪ICP备15018463号-20