
Hui Luo, Chen Jia, Jian Li. Road Surface Disease Detection Algorithm Based on Improved YOLOv4[J]. Laser & Optoelectronics Progress, 2021, 58(14): 1410025
- Laser & Optoelectronics Progress
- Vol. 58, Issue 14, 1410025 (2021)
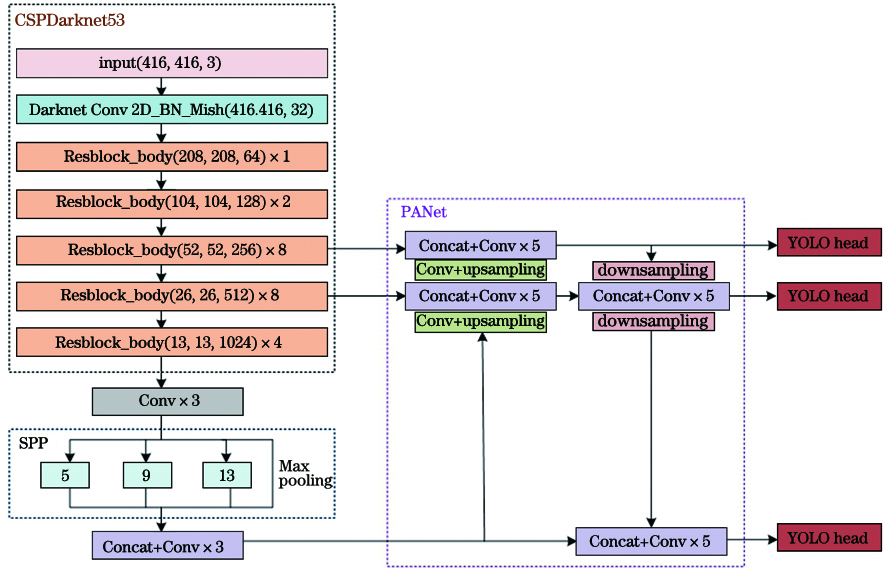
Fig. 1. Network structure of YOLOv4
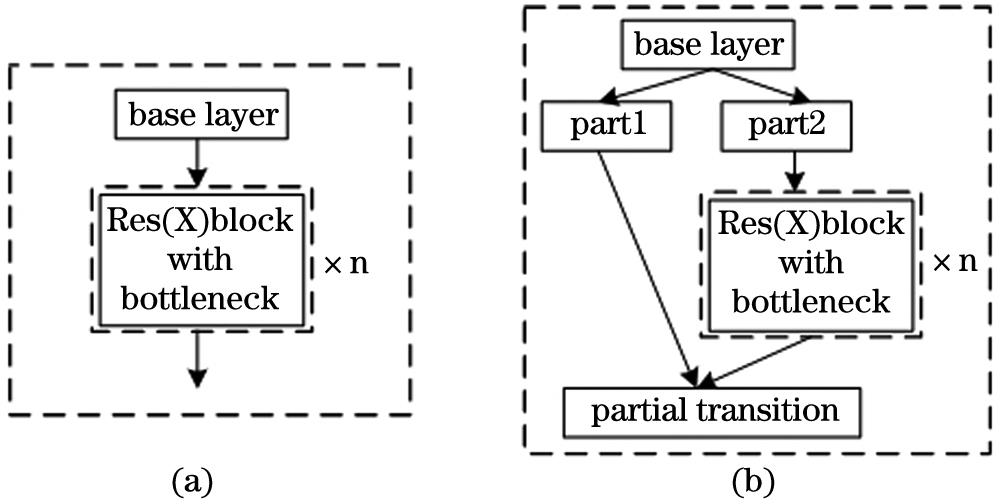
Fig. 2. Schematic diagram of CSPResNet. (a) Resblock_body; (b) CSPResNet(X)t
Fig. 3. Standard convolution process
Fig. 4. Depth separable convolution process
Fig. 5. Standard convolution and depth separable convolution model based on YOLOv4 network structure. (a) Standard convolution model; (b) depth separate convolution model
Fig. 6. Examples of data set and label for road surface disease. (a) Examples of data set for road surface disease; (b) examples of label for road surface disease
Fig. 7. Examples of road surface disease data augmenting
Fig. 8. Changes of training losses based on improved YOLOv4
Fig. 9. Comparison of P-R curves for road surface disease based on different network models
Fig. 10. Detection results of road surface disease based on different network models. (a) Input images; (b) Faster R-CNN; (c) SSD; (d) YOLOv3; (e) YOLOv4; (f) YOLOv4+DC; (g) YOLOv4+FL; (h) YOLOv4+DC+FL
| |||||||||||||||||||||||||||||
Table 1. Data augmenting methods of different road surface disease types
|
Table 2. Sample distribution of road surface disease data
| ||||||||||||||||||||||||||||||||||||||||||||||||||||||||||||||
Table 3. Comparison of detection results of road surface disease based on different network models

Set citation alerts for the article
Please enter your email address
© Copyright 2018-2021 | Chinese Laser Press. All Rights Reserved 沪ICP备15018463号-20