
Peng Suo, Shengnan Yan, Ruihua Pu, Wenjie Zhang, Di Li, Jiaming Chen, Jibo Fu, Xian Lin, Feng Miao, Shi-Jun Liang, Weimin Liu, Guohong Ma, "Ultrafast photocarrier and coherent phonon dynamics in type-II Dirac semimetal PtTe2 thin films probed by optical spectroscopy," Photonics Res. 10, 653 (2022)
- Photonics Research
- Vol. 10, Issue 3, 653 (2022)
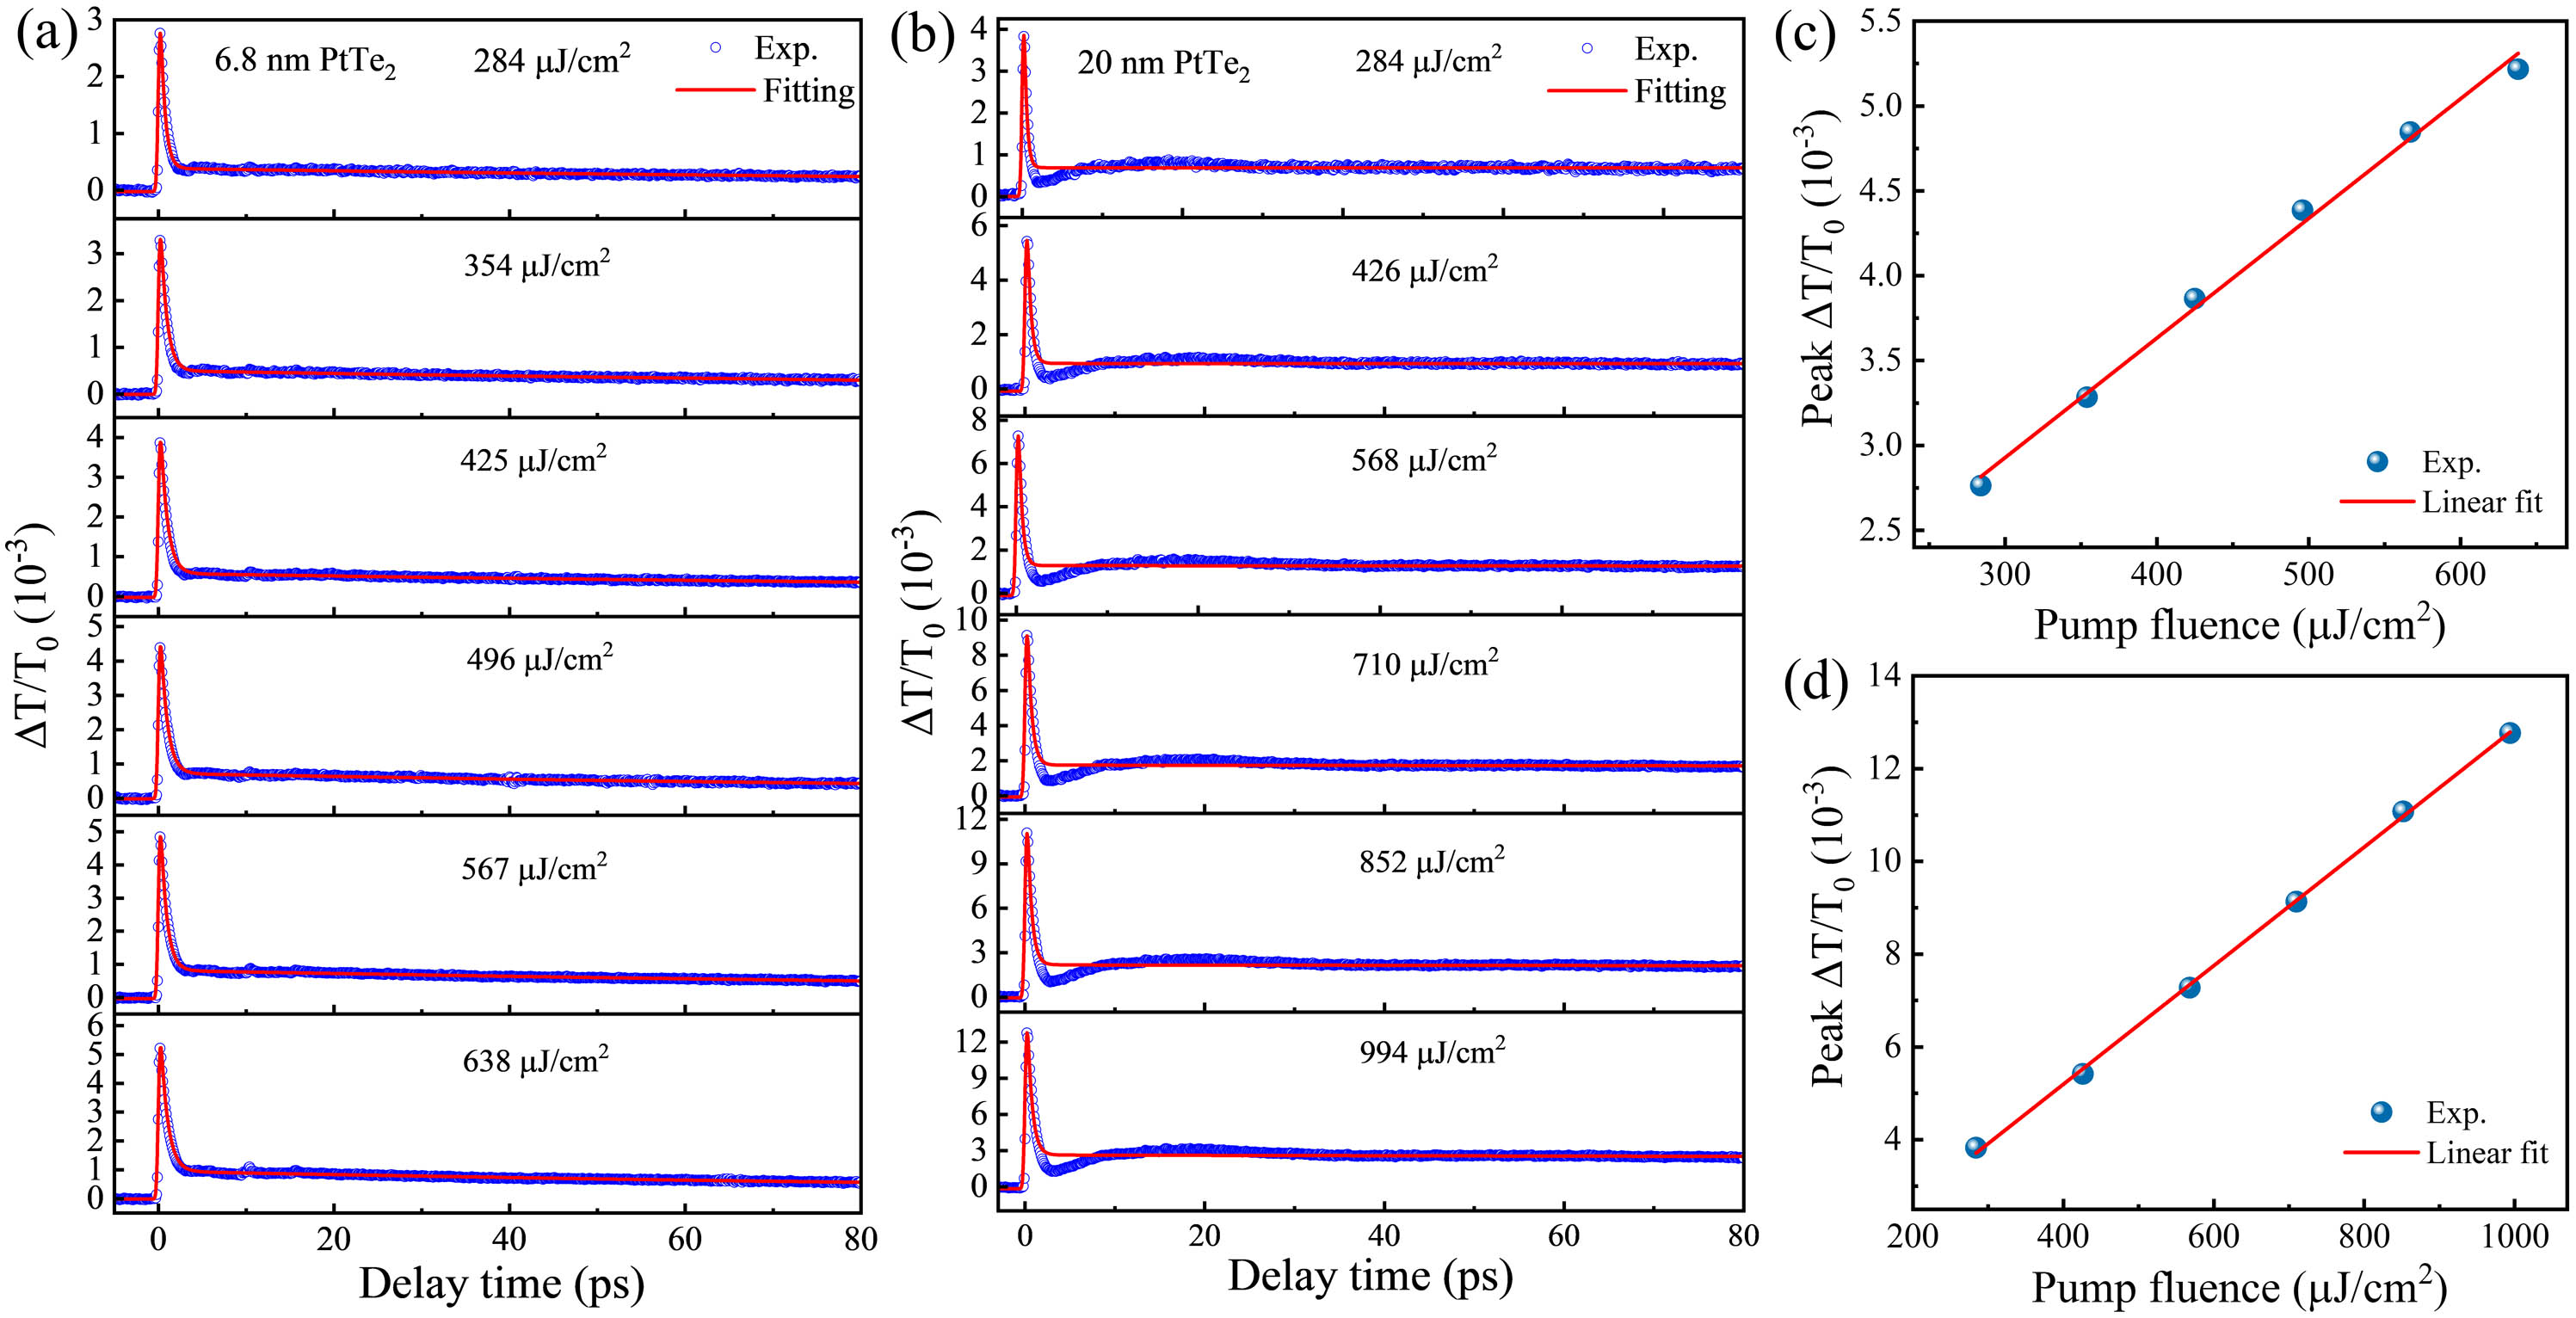
Fig. 1. Time-resolved transient transmission trace Δ T / T 0 PtTe 2 Δ T / T 0 PtTe 2
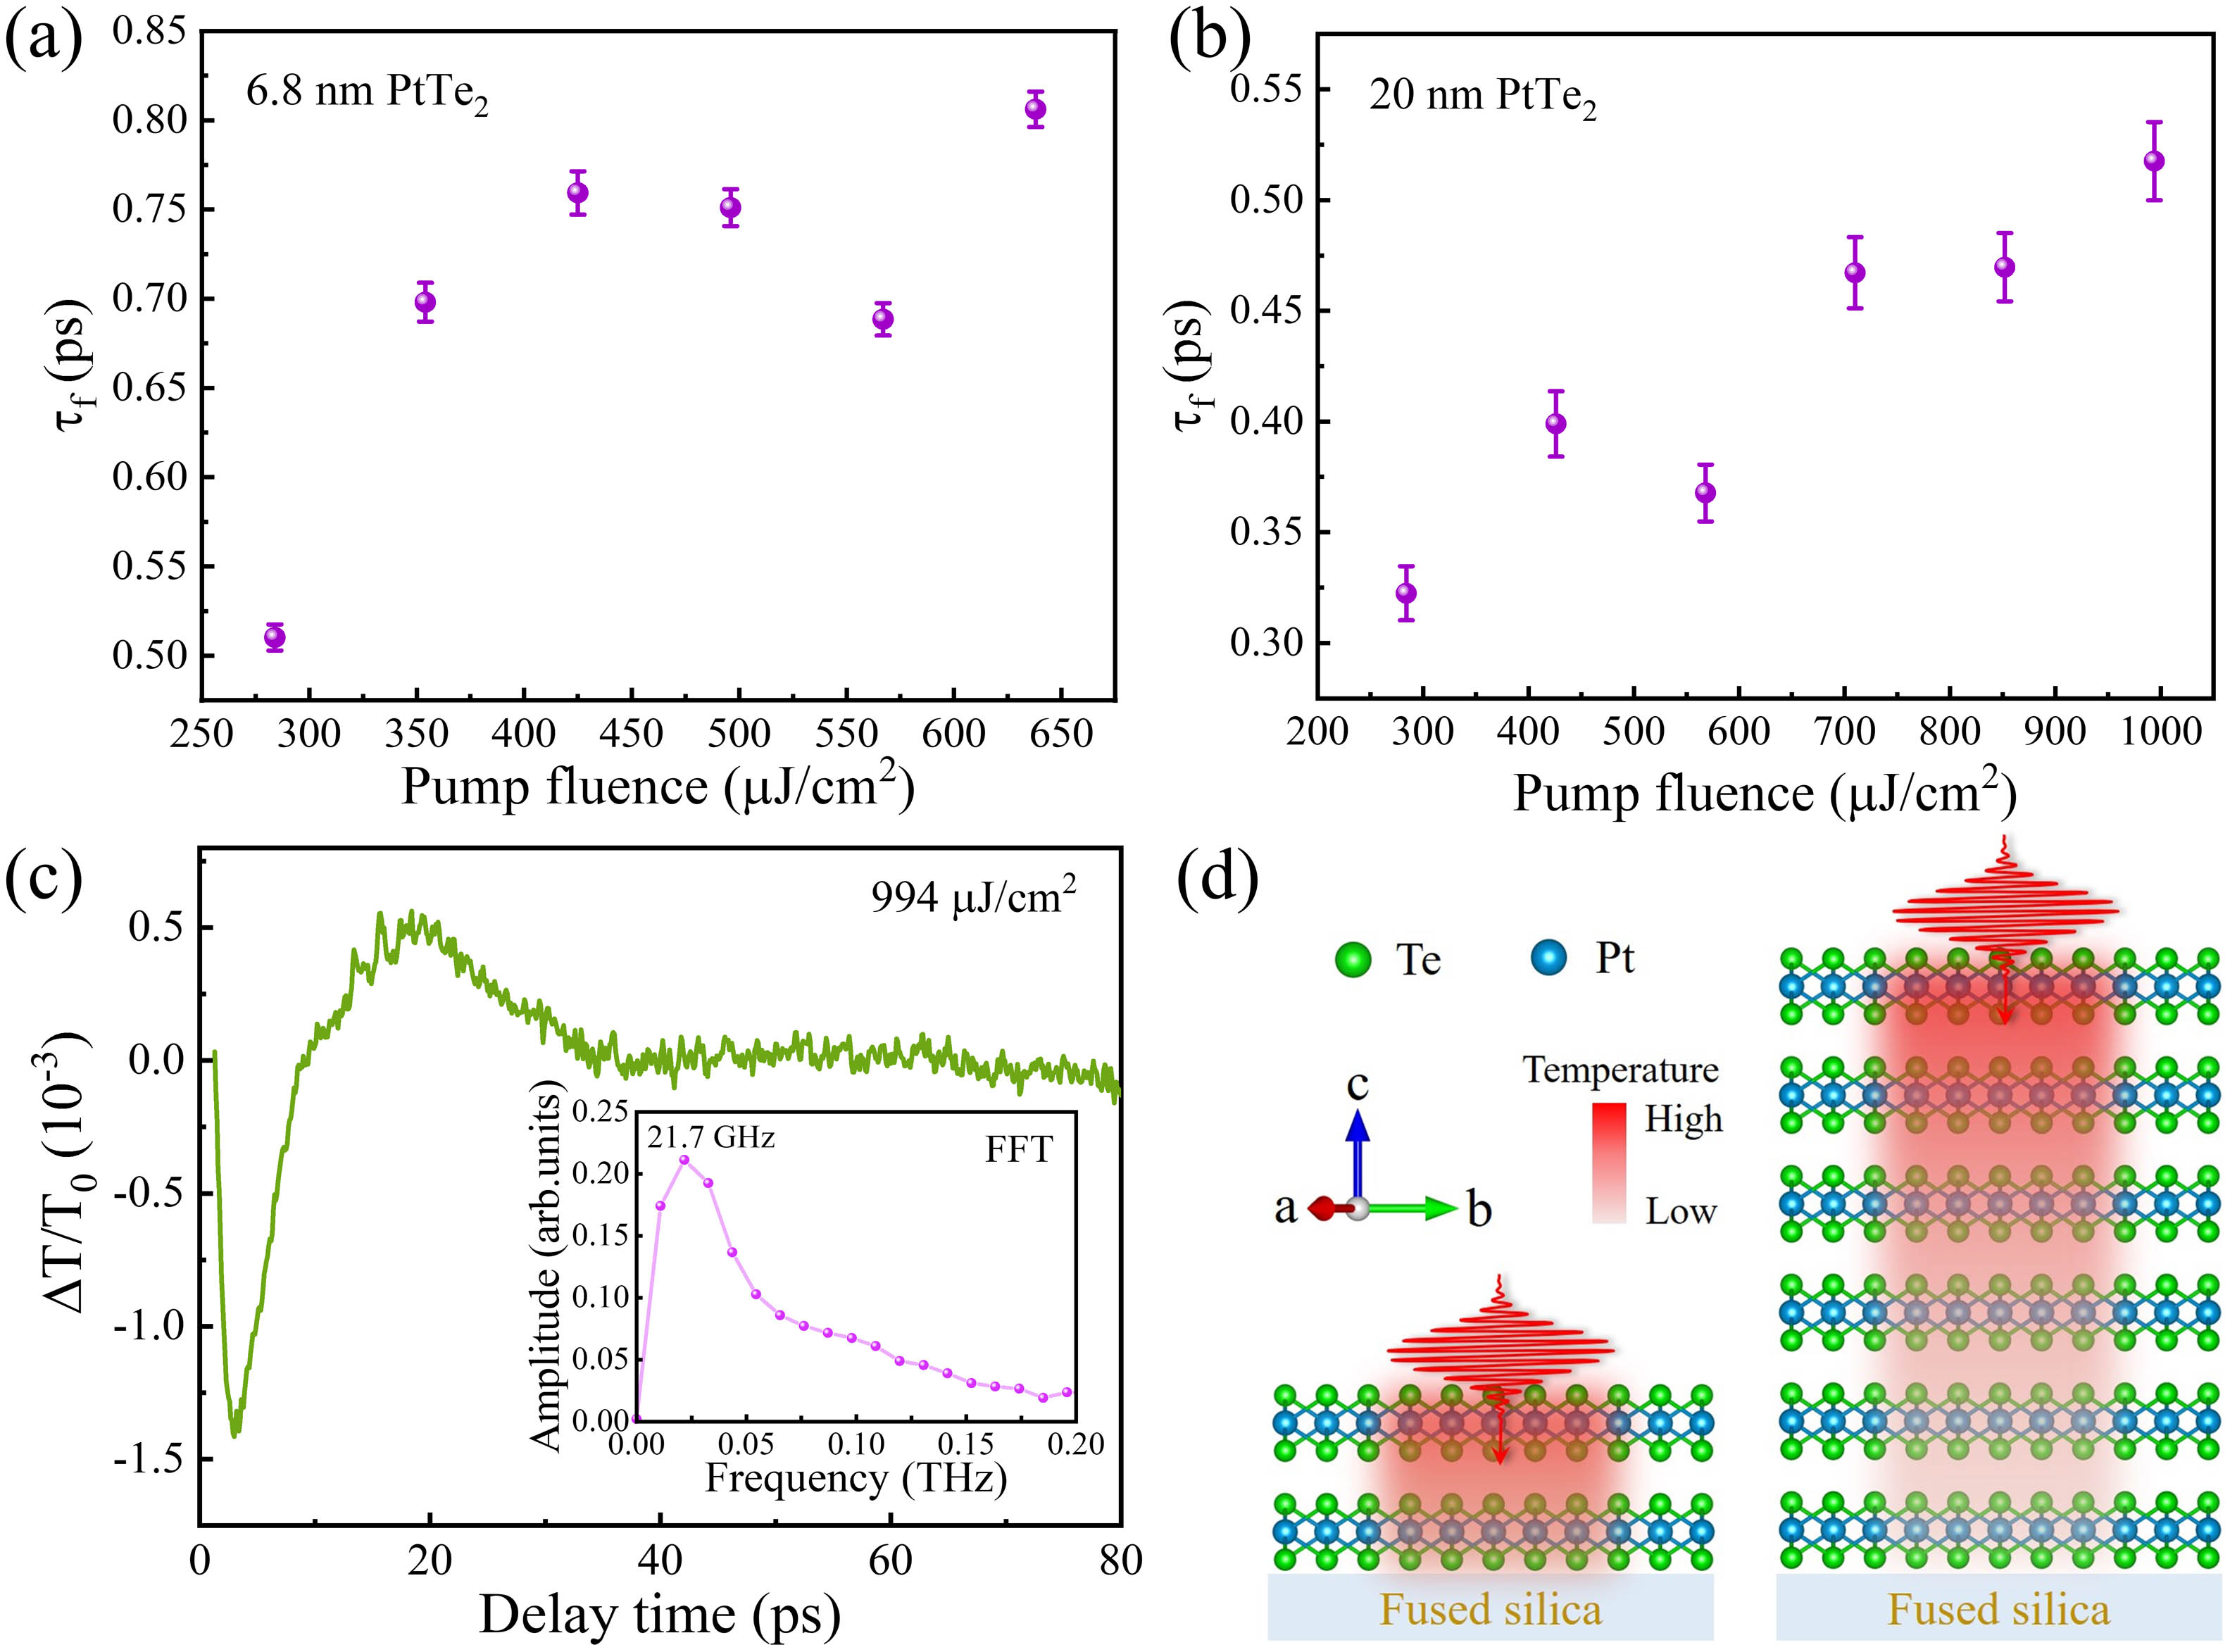
Fig. 2. Fitting fast lifetime τ f PtTe 2 994 μJ / cm 2 PtTe 2
Fig. 3. Time- and spectrum-resolved ultrafast TA mapping of (a) 6.8 nm PtTe 2 PtTe 2 1 mJ / cm 2 PtTe 2
Fig. 4. Probe wavelength-dependent COP dynamics of PtTe 2 PtTe 2 PtTe 2 PtTe 2 PtTe 2
Fig. 5. The TA plotting of (a) 6.8 nm and (b) 20 nm PtTe 2
Fig. 6. Residual periodical oscillatory signals of 6.8 nm PtTe 2
Fig. 7. Damping time of coherent optical phonon of 6.8 nm PtTe 2


Set citation alerts for the article
Please enter your email address

© Copyright 2018-2021 | Chinese Laser Press. All Rights Reserved 沪ICP备15018463号-20