• Chinese Optics Letters
  • Vol. 18, Issue 1, 011202 (2020)
Liang Cao1、2, Yang Yu1、3、*, Min Xiao3, Junbo Yang3, Xueliang Zhang4, and Zhou Meng1
Author Affiliations
  • 1College of Meteorology and Oceanology, National University of Defense Technology, Changsha 410073, China
  • 2Unit 45, No. 91388 Troops of PLA, Zhanjiang 524022, China
  • 3College of Liberal Arts and Sciences, National University of Defense Technology, Changsha 410073, China
  • 4Hunan Aerospace Institute of Electromechanical Devices and Special Material, Changsha 410073, China
  • show less
    DOI: 10.3788/COL202018.011202 Cite this Article Set citation alerts
    Liang Cao, Yang Yu, Min Xiao, Junbo Yang, Xueliang Zhang, Zhou Meng. High sensitivity conductivity-temperature-depth sensing based on an optical microfiber coupler combined fiber loop[J]. Chinese Optics Letters, 2020, 18(1): 011202 Copy Citation Text show less
    Schematic of MCFL composition.
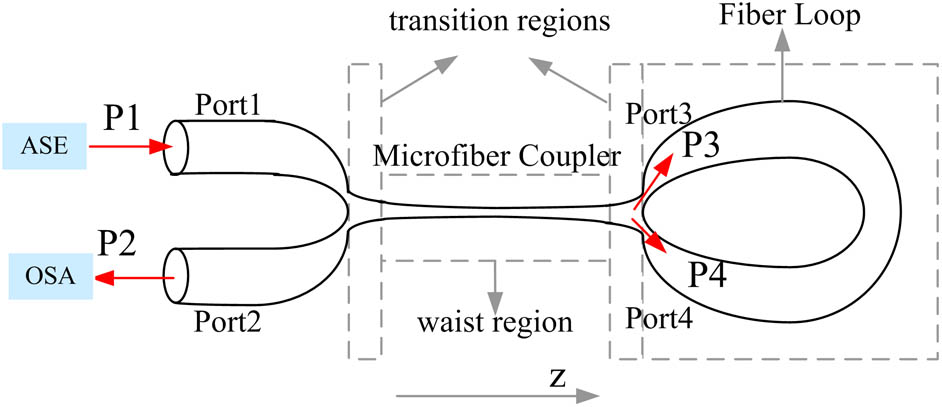
    Fig. 1. Schematic of MCFL composition.
    (a) Schematic of the experiment setup for measurement of salinity, temperature, and depth in seawater. (b) The salinity measuring experimental setup and the optical microscopic image of the MCFL (Inset). (c) The temperature measuring experimental setup. (d) The depth measuring experimental setup and the optical microscopic image of the MCFL (Inset).
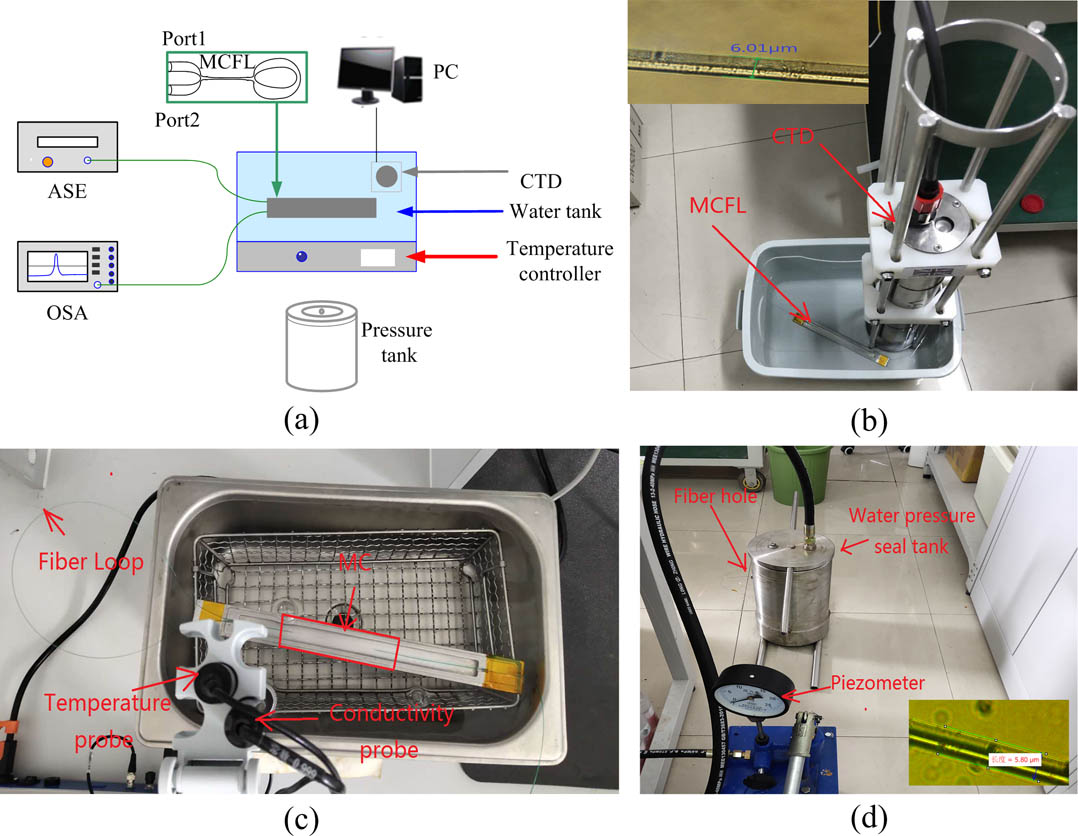
    Fig. 2. (a) Schematic of the experiment setup for measurement of salinity, temperature, and depth in seawater. (b) The salinity measuring experimental setup and the optical microscopic image of the MCFL (Inset). (c) The temperature measuring experimental setup. (d) The depth measuring experimental setup and the optical microscopic image of the MCFL (Inset).
    Transmission spectra at different salinities.
    Fig. 3. Transmission spectra at different salinities.
    Relationships between the characteristic wavelengths and the salinities.
    Fig. 4. Relationships between the characteristic wavelengths and the salinities.
    Transmission spectra at different temperatures.
    Fig. 5. Transmission spectra at different temperatures.
    Relationships between the characteristic wavelengths and the temperatures.
    Fig. 6. Relationships between the characteristic wavelengths and the temperatures.
    Transmission spectra at different pressures.
    Fig. 7. Transmission spectra at different pressures.
    Relationships between the characteristic wavelengths and the pressures.
    Fig. 8. Relationships between the characteristic wavelengths and the pressures.
    Liang Cao, Yang Yu, Min Xiao, Junbo Yang, Xueliang Zhang, Zhou Meng. High sensitivity conductivity-temperature-depth sensing based on an optical microfiber coupler combined fiber loop[J]. Chinese Optics Letters, 2020, 18(1): 011202
    Download Citation