• Chinese Optics Letters
  • Vol. 15, Issue 8, 083001 (2017)
Yi Zheng1、2, Xiangping Zhu1, Zhe Wang3, Zongyu Hou3, Fei Gao1, Rongzhi Nie1、4, Xiaoxia Cui1, Jiangbo She1, and Bo Peng1、*
Author Affiliations
  • 1State Key Laboratory of Transient Optics and Photonics, Xi’an Institute of Optics and Precision Mechanics, Chinese Academy of Science (CAS), Xi’an 710119, China
  • 2University of Chinese Academy of Sciences (CAS), Beijing 100049, China
  • 3State Key Laboratory of Power Systems, Department of Thermal Engineering, Tsinghua-BP Clean Energy Center, Tsinghua University, Beijing 100084, China
  • 4School of Science, Xi’an Jiaotong University, Xi’an 710049, China
  • show less
    DOI: 10.3788/COL201715.083001 Cite this Article Set citation alerts
    Yi Zheng, Xiangping Zhu, Zhe Wang, Zongyu Hou, Fei Gao, Rongzhi Nie, Xiaoxia Cui, Jiangbo She, Bo Peng. Noninvasive blood glucose detection using a miniature wearable Raman spectroscopy system[J]. Chinese Optics Letters, 2017, 15(8): 083001 Copy Citation Text show less
    Experimental setup: the schematic diagram of the miniature wearable Raman spectroscopy system.
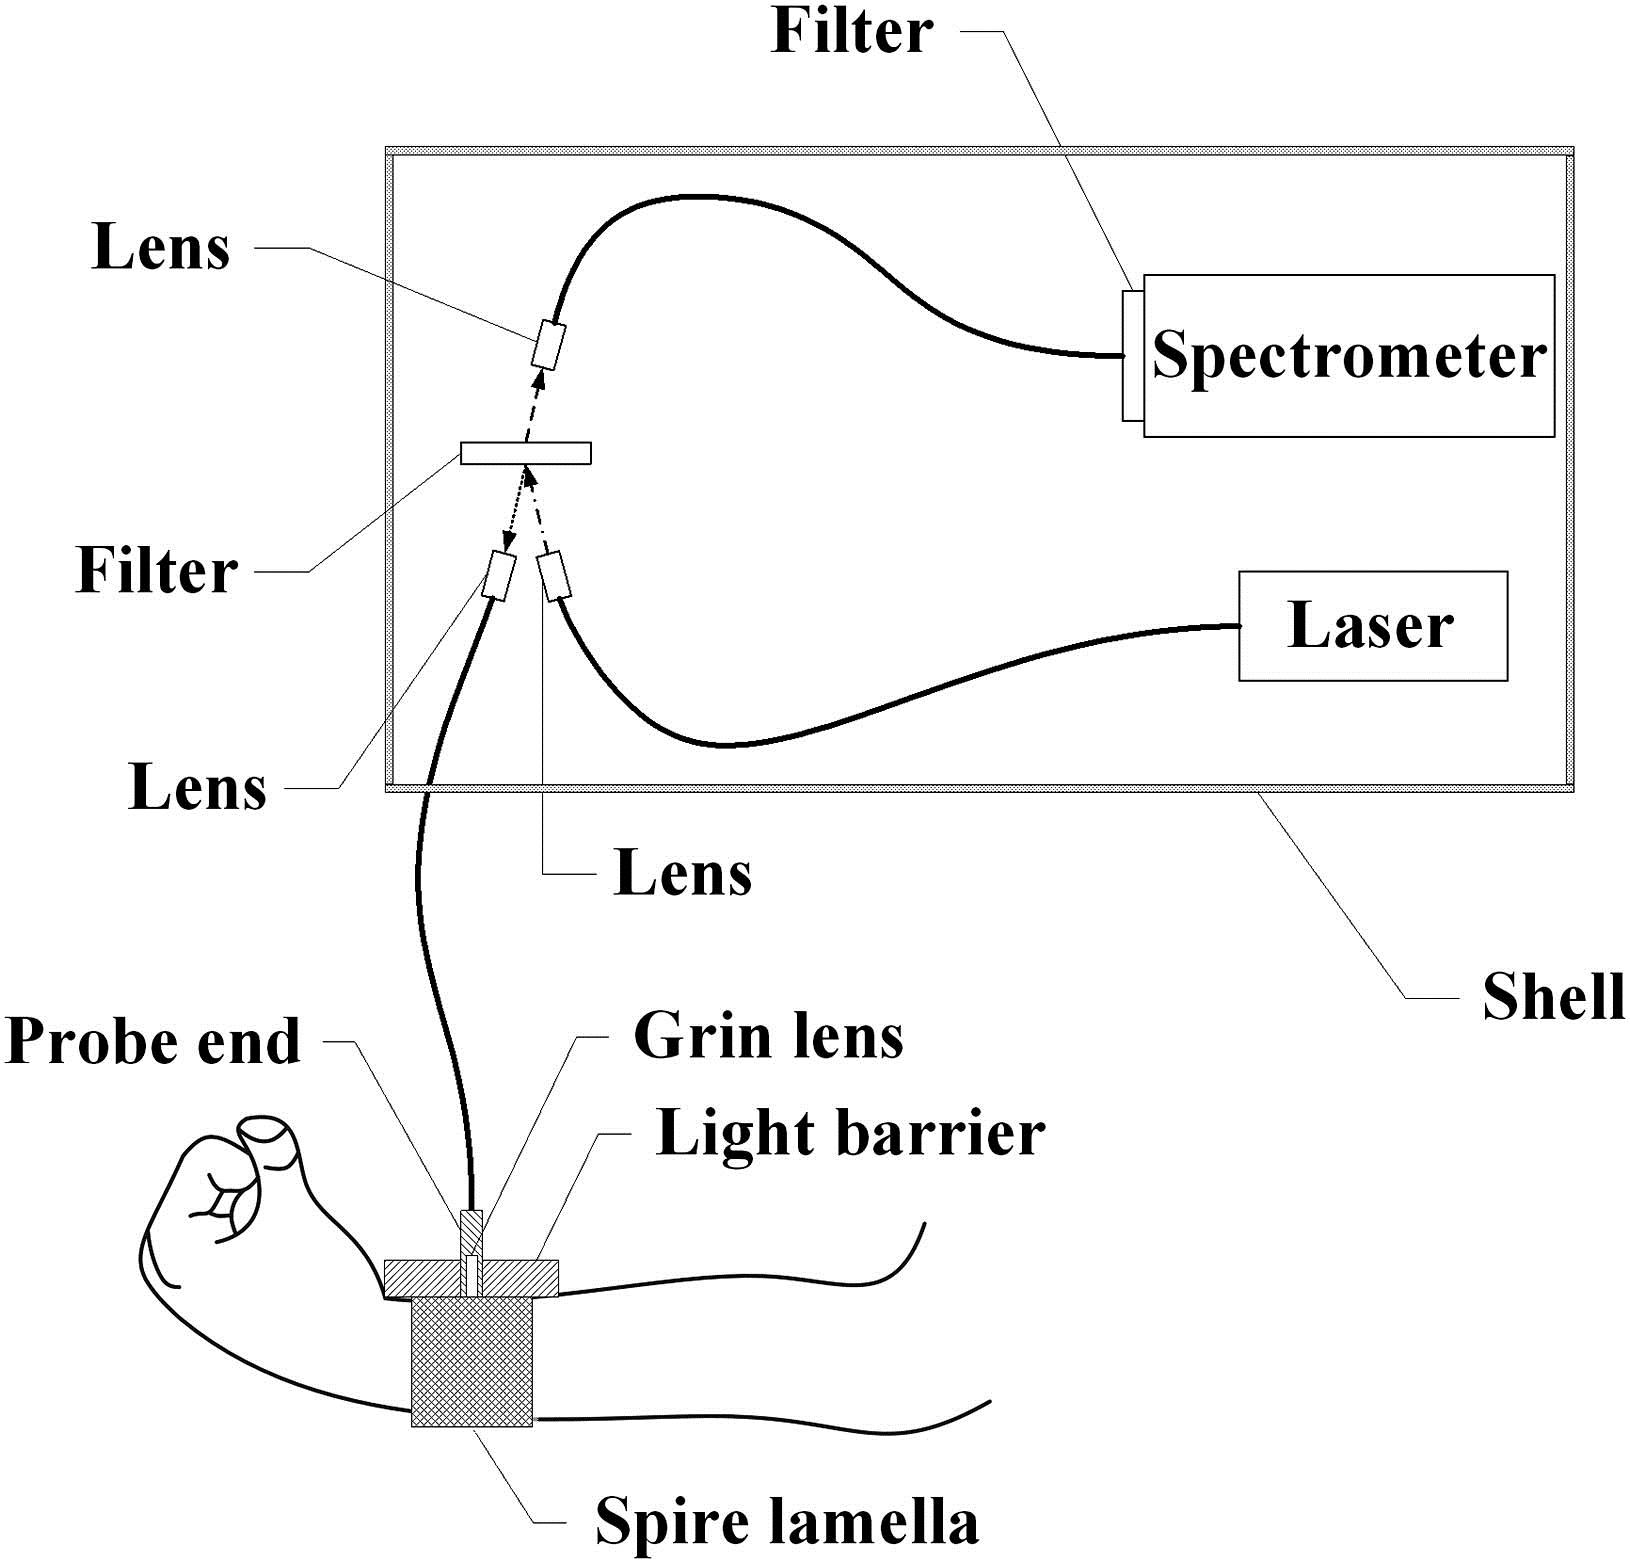
    Fig. 1. Experimental setup: the schematic diagram of the miniature wearable Raman spectroscopy system.
    (Color online) Raman spectra of glucose solutions with concentrations of 3.8–13.3 mmol/L. The area of 1372.7 cm−1 and the concentration of glucose are directly related.
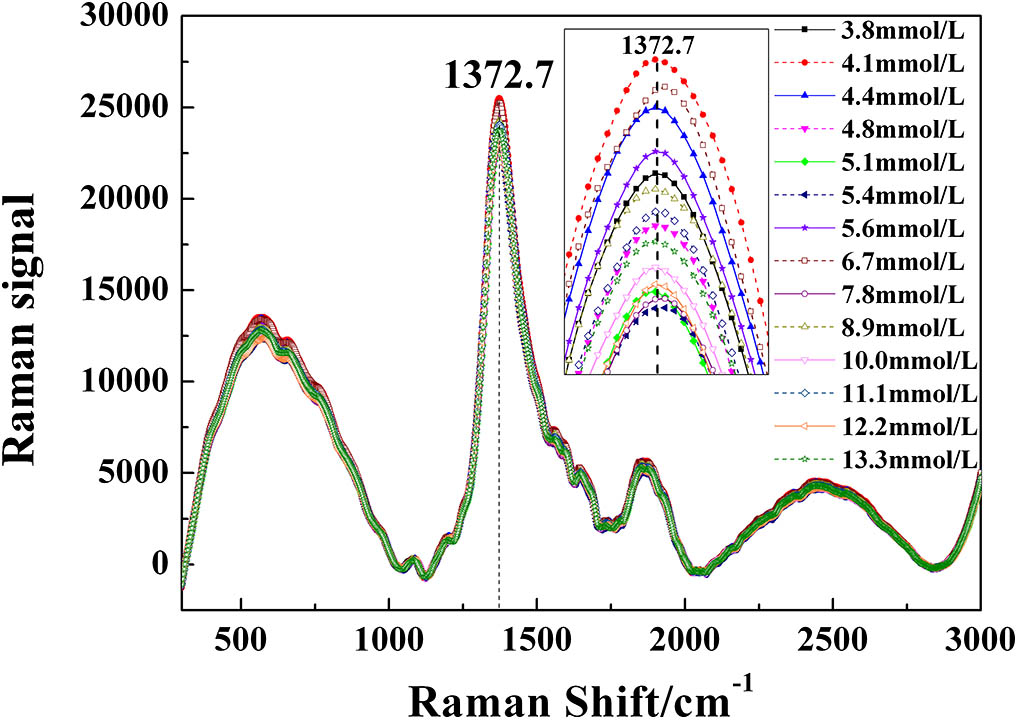
    Fig. 2. (Color online) Raman spectra of glucose solutions with concentrations of 3.8–13.3 mmol/L. The area of 1372.7cm1 and the concentration of glucose are directly related.
    (Color online) Difference between the relationship of the peak area and intensity with the concentration of the glucose solution.
    Fig. 3. (Color online) Difference between the relationship of the peak area and intensity with the concentration of the glucose solution.
    (Color online) Calculated result of the glucose solution, with a coefficient of determination of 98.1% and an MAE of 0.394 mmol/L.
    Fig. 4. (Color online) Calculated result of the glucose solution, with a coefficient of determination of 98.1% and an MAE of 0.394 mmol/L.
    (Color online) Comparison between the spectrum of the rat skin and the spectrum of the glucose solution. The spectrum of the rat skin is more complicated.
    Fig. 5. (Color online) Comparison between the spectrum of the rat skin and the spectrum of the glucose solution. The spectrum of the rat skin is more complicated.
    (Color online) Calculated results for one of the rat samples.
    Fig. 6. (Color online) Calculated results for one of the rat samples.
    (Color online) (A) Comparison between the spectrum of the human skin and the spectrum of the rat skin. (B) Comparison between the spectrum of the human skin and the spectrum of glucose. The spectrum of the human skin is similar to the spectrum of the rat skin.
    Fig. 7. (Color online) (A) Comparison between the spectrum of the human skin and the spectrum of the rat skin. (B) Comparison between the spectrum of the human skin and the spectrum of glucose. The spectrum of the human skin is similar to the spectrum of the rat skin.
    (A) Calculated result for one of the human volunteers without using a grin lens. (B) Calculated result for one of the human volunteers using a grin lens. The result when using a grin lens is obviously better.
    Fig. 8. (A) Calculated result for one of the human volunteers without using a grin lens. (B) Calculated result for one of the human volunteers using a grin lens. The result when using a grin lens is obviously better.
    (Color online) Comparison between calculated results for all samples and one of the samples.
    Fig. 9. (Color online) Comparison between calculated results for all samples and one of the samples.
    RatR2MAE (mmol/L)Sample Capacity
    10.9600.14925
    20.9540.265147
    30.9240.54353
    40.9050.31077
    50.8930.27953
    60.8890.13023
    70.8790.22724
    80.8680.18423
    90.8530.15930
    100.8510.217229
    110.8510.30651
    Mean0.8930.25267
    Table 1. Summary of Results from Cross-Validated Calibrations Generated from Data Set of Measurements on Each of the 11 Laboratory Rats
    HumanR2MAE (mmol/L)Sample Capacity
    10.9580.10529
    20.9350.37959
    30.8660.28521
    40.850.27537
    50.8350.39835
    60.830.40737
    70.8270.62035
    80.8150.31735
    90.7650.45535
    100.7590.41021
    Mean0.8440.36534
    Table 2. Summary of Results from Cross-Validated Calibrations Generated from Data Set of Measurements on Each of the 10 Human Volunteers
    Yi Zheng, Xiangping Zhu, Zhe Wang, Zongyu Hou, Fei Gao, Rongzhi Nie, Xiaoxia Cui, Jiangbo She, Bo Peng. Noninvasive blood glucose detection using a miniature wearable Raman spectroscopy system[J]. Chinese Optics Letters, 2017, 15(8): 083001
    Download Citation