
Yi Zheng, Xiangping Zhu, Zhe Wang, Zongyu Hou, Fei Gao, Rongzhi Nie, Xiaoxia Cui, Jiangbo She, Bo Peng, "Noninvasive blood glucose detection using a miniature wearable Raman spectroscopy system," Chin. Opt. Lett. 15, 083001 (2017)
- Chinese Optics Letters
- Vol. 15, Issue 8, 083001 (2017)
Abstract
Nowadays, there are about 415 million adults suffering from diabetes[
Various methods, such as Raman spectroscopy[
However, conventional laboratory Raman systems, with their large size, cumbersome nature, and high cost, are limited in clinical applications. Additionally, the stability is not good enough. Conventional Raman detection systems always utilize a convex lens with a certain focal length as the collecting lens, but the focal position will change during the measurement. The problem that Raman signal cannot be stably collected will greatly affect the accuracy and stability of the test.
Sign up for Chinese Optics Letters TOC. Get the latest issue of Chinese Optics Letters delivered right to you!Sign up now
In this Letter, a thallium-doped grin lens was employed as the collection lens. A specially designed wearable fiber-optic probe was employed to help the stable and convenient collection of the Raman spectrum. A novel method of quantitative analysis of the Raman spectrum that uses the peak area as the main reference factor and the peak intensity as the auxiliary reference factor to calculate the target concentration was proposed. A nonlinearized multivariate dominant factor-based partial least squares (PLS) model was employed for different samples to predict the glucose levels. A glucose solution, 11 rats, and 10 healthy humans were studied as the subjects.
Figure
![]()
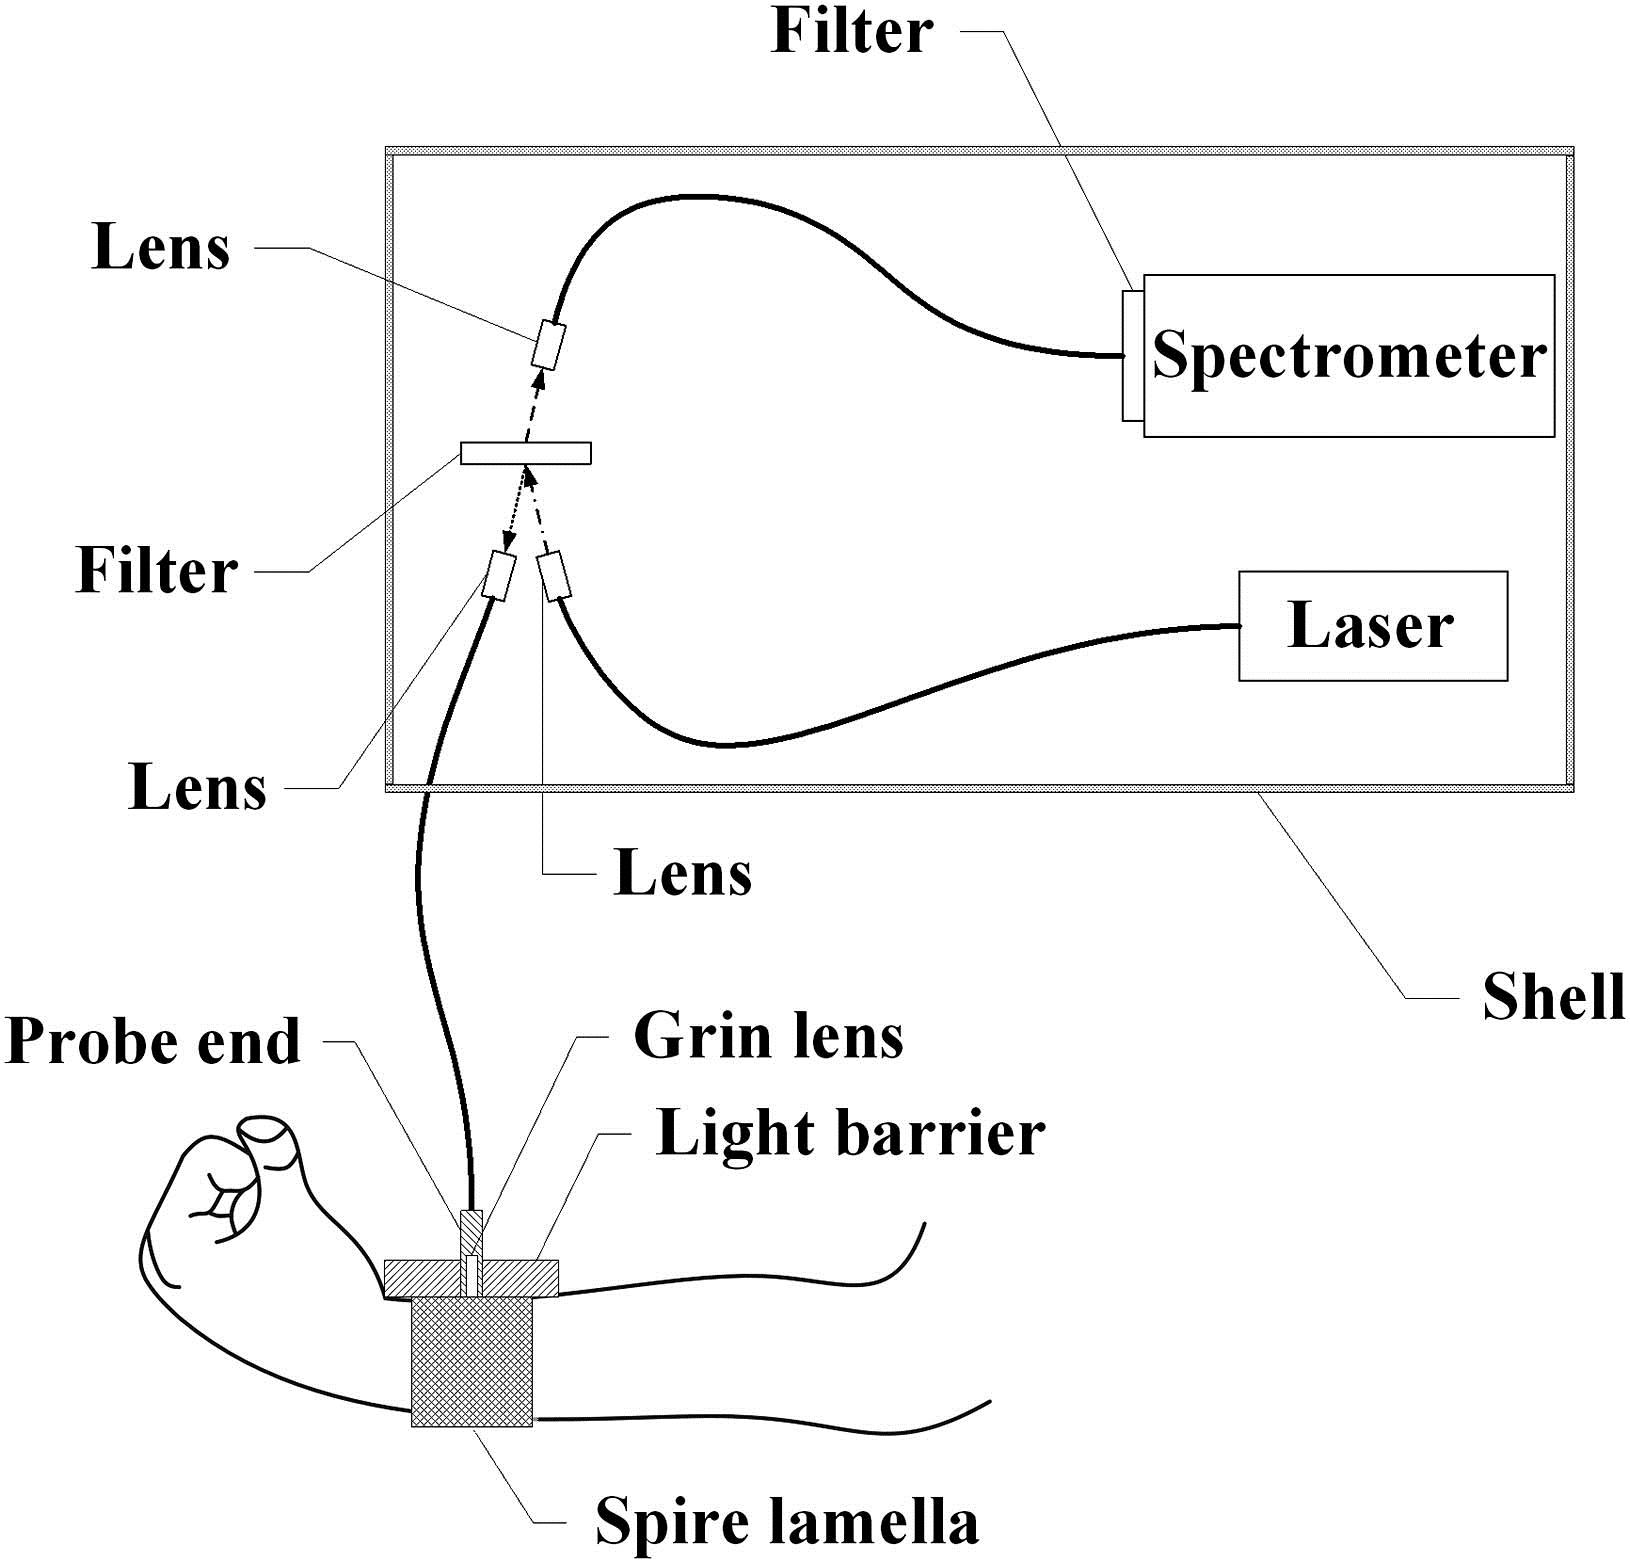
Figure 1.Experimental setup: the schematic diagram of the miniature wearable Raman spectroscopy system.
A specially designed wearable fiber-optic probe was employed. The probe end packaged the grin lens, while a shading tube was designed to reduce the interference of ambient light and to help fasten the probe with a spire lamella. This probe utilized a thallium-doped grin lens as the collecting lens, which could ensure that the focal position is always on the surface of the measured object while realizing the convergence of wide-band spectra. Only one kind of filter (Semrock, LP02-785RU-25), which could reflect the light below 785 nm while transmitting the light between 805 and 1050 nm, was used in this probe. The function of this filter amounted to the function of a dichroic mirror and a bandpass filter.
Compared with a conventional probe, this probe had the advantages of better testing stability and lower cost and is convenient to wear.
A miniature Raman spectrometer (B&Wtek, BTC675 N-OEM), with dimensions of
All of the components were immobilized compactly to achieve the miniaturization of this system.
Glucose solutions which aimed to reflect the blood glucose levels of humans (4.4–11.1 mmol/L) were prepared, with different concentrations of 3.8, 4.1, 4.4, 4.8, 5.1, 5.4, 5.6, 6.7, 7.8, 8.9, 10, 11.1, 12.2, and 13.3 mmol/L. A cuvette containing the glucose solution was put into a dark sample cup to ensure the stabilization of the test. Raman spectra were collected after 20 s. The glucose solution study was employed for verifying the feasibility of in vitro glucose detection using the miniature wearable Raman system.
Eleven Sprague–Dawley (SD) male rats were studied as samples. We here claim that our protocol was approved by XIOPM’s committee on the use of SD rats and human volunteers as experimental subjects. After fasting for 8 h, the rats were anesthetized. Then, the glucose solution was poured into the stomachs of rats. As a result, the blood glucose levels of the rats varied within 1.5 h. Raman spectra were collected transcutaneously every 5 min from the ears of the rats along with glucose reference values provided by a blood glucose meter (Roche, ACCU-CHEK, Active). The laboratory rat study was employed for verifying the feasibility of noninvasive detection of an in vivo blood glucose level using the miniature wearable Raman system.
Ten human volunteers were investigated as samples. Volunteers took a certain dose (2 g/kg) of glucose solution orally. During the next 2 h, Raman spectra were collected transcutaneously every 20 min from the inside of the wrist while glucose reference values were provided by a blood glucose meter. Every volunteer was tested at least 3 times to ensure the repeatability of the experiment. The skin of the human volunteers was not damaged during the test. The human subject study was employed for verifying the feasibility of noninvasive detection of human blood glucose level using the miniature wearable Raman system.
The area of characteristic peaks was used mainly as a calibration reference, while the intensity was used as an auxiliary calibration reference to avoid the interference of baseline fluctuations of Raman spectra. Raman spectra were extracted at the range of
A dominant factor-based multivariate PLS model was employed to predict the glucose concentration[
Figure
![]()
Figure 2.(Color online) Raman spectra of glucose solutions with concentrations of 3.8–13.3 mmol/L. The area of
![]()
Figure 3.(Color online) Difference between the relationship of the peak area and intensity with the concentration of the glucose solution.
![]()
Figure 4.(Color online) Calculated result of the glucose solution, with a coefficient of determination of 98.1% and an MAE of 0.394 mmol/L.
Figure
![]()
Figure 5.(Color online) Comparison between the spectrum of the rat skin and the spectrum of the glucose solution. The spectrum of the rat skin is more complicated.
![]()
Figure 6.(Color online) Calculated results for one of the rat samples.
Each sample was processed individually in the same method, and the results are shown in Table
| Rat | MAE | Sample | |
|---|---|---|---|
| 1 | 0.960 | 0.149 | 25 |
| 2 | 0.954 | 0.265 | 147 |
| 3 | 0.924 | 0.543 | 53 |
| 4 | 0.905 | 0.310 | 77 |
| 5 | 0.893 | 0.279 | 53 |
| 6 | 0.889 | 0.130 | 23 |
| 7 | 0.879 | 0.227 | 24 |
| 8 | 0.868 | 0.184 | 23 |
| 9 | 0.853 | 0.159 | 30 |
| 10 | 0.851 | 0.217 | 229 |
| 11 | 0.851 | 0.306 | 51 |
| Mean | 0.893 | 0.252 | 67 |
Table 1. Summary of Results from Cross-Validated Calibrations Generated from Data Set of Measurements on Each of the 11 Laboratory Rats
Figure
![]()
Figure 7.(Color online) (A) Comparison between the spectrum of the human skin and the spectrum of the rat skin. (B) Comparison between the spectrum of the human skin and the spectrum of glucose. The spectrum of the human skin is similar to the spectrum of the rat skin.
Figure
![]()
Figure 8.(A) Calculated result for one of the human volunteers without using a grin lens. (B) Calculated result for one of the human volunteers using a grin lens. The result when using a grin lens is obviously better.
The results for all of the human volunteers are shown in Table
| Human | MAE | Sample | |
|---|---|---|---|
| 1 | 0.958 | 0.105 | 29 |
| 2 | 0.935 | 0.379 | 59 |
| 3 | 0.866 | 0.285 | 21 |
| 4 | 0.85 | 0.275 | 37 |
| 5 | 0.835 | 0.398 | 35 |
| 6 | 0.83 | 0.407 | 37 |
| 7 | 0.827 | 0.620 | 35 |
| 8 | 0.815 | 0.317 | 35 |
| 9 | 0.765 | 0.455 | 35 |
| 10 | 0.759 | 0.410 | 21 |
| Mean | 0.844 | 0.365 | 34 |
Table 2. Summary of Results from Cross-Validated Calibrations Generated from Data Set of Measurements on Each of the 10 Human Volunteers
Figures
![]()
Figure 9.(Color online) Comparison between calculated results for all samples and one of the samples.
The reasons for these results may come from two aspects: individual differences and physiological changes. However, we anticipate that the more accurate result can be predicted by the methods of big data statistics and establishing a glucose database.
In conclusion, signal acquisition and data analysis are the 2 major bottlenecks of noninvasive blood glucose detection. In this Letter, a novel method of Raman spectra collection is investigated. A thallium-doped grin lens is employed as the collection lens. A specially designed wearable fiber-optic probe is employed to help the stable and convenient collection of the Raman spectrum. A miniature wearable Raman system is developed to achieve the noninvasive blood glucose detection. The area of characteristic peaks is used as the main calibration reference, while the intensity is used as the auxiliary calibration reference. Additionally, a dominant factor-based multivariate PLS model is constructed to achieve the accurate prediction of blood glucose levels. This serious study investigates
References
[2] D. C. Klonoff. Diabetes Care, 20, 433(1997).
[6] W. C. Shih, K. L. Bechtel, M. V. Rebec. J. Biomed. Opt., 20, 051036(2015).
[7] W. C. Shih, K. L. Bechtel, M. S. Feld. Opt. Express., 16, 12726(2008).
[8] K. L. Bechtel, W. C. Shih, M. S. Feld. Opt. Express, 16, 12737(2008).
[9] A. J. Berger, I. Itzkan, M. S. Feld. Spectrochim. Acta A Mol. Biomol. Spectrosc., 53A, 287(1997).
[10] A. J. Berger, T. W. Koo, I. Itzkan, G. Horowitz, M. S. Feld. Appl. Opt., 38, 2916(1999).
[13] X. Tan, L. Jiang, J. Hu, P. Liu, A. Wang, Y. Lu. Chin. Opt. Lett., 13, 111401(2015).
[15] S. F. Malin, T. L. Ruchti, T. B. Blank, S. N. Thennadil, S. L. Monfre. Clin. Chem., 45, 1651(1999).
[16] J. Liu, R. Liu, K. Xu. Appl. Spectrosc., 69, 1313(2015).
[17] H. A. Mackenzie, H. S. Ashton, S. Spiers, Y. Shen, S. S. Freeborn, J. Hannigan, J. Lindberg, P. Rae. Clin. Chem., 45, 1587(1999).
[18] R. Weiss, Y. Yegorchikov, A. Shusterman, I. Raz. Diabetes Technol. Ther., 9, 68(2007).
[19] L. Zhu, J. Lin, B. Lin, H. Li. Chin. Opt. Lett., 11, 021701(2013).
[20] M. G. Ghosn, V. V. Tuchin, K. V. Larin. Opt. Lett., 31, 2314(2006).
[21] J. Feng, Z. Wang, L. Z. Li, Z. Li, W. D. Ni. Appl. Spectrosc., 67, 291(2013).
[22] Z. Wang, J. Feng, L. Z. Li, W. D. Ni, Z. Li. J. Anal. At. Spectrom., 26, 2289(2011).
[23] J. Feng, Z. Wang, L. West, Z. Li, W. D. Ni. Anal. Bioanal. Chem., 400, 3261(2011).


Set citation alerts for the article
Please enter your email address

© Copyright 2018-2021 | Chinese Laser Press. All Rights Reserved 沪ICP备15018463号-20