Department of Precision Instrument, State Key Laboratory of Precision Measurement Technology and Instruments, Tsinghua University, Beijing 100084, China
Exploiting the time-resolving ability of ultrafast pulses, Fourier-transform coherent anti-Stokes Raman scattering (FT-CARS) stands out among the coherent Raman spectroscopic techniques for providing high-speed vibrational spectra with high spectral resolution, high Raman intensity, and immunity to nonresonant background. However, the impulsive stimulation nature of FT-CARS imposes heavy demands on the laser source and makes it inherently difficult to monitor high-frequency vibrations. Here, a novel FT-CARS strategy to our knowledge based on interpulse stimulation is proposed to provide more flexible measuring wavenumber region and lighten the requirement on ultrafast pulses. The mechanism of this technique is analyzed theoretically, and simulation is performed to show an orders-of-magnitude improvement of Raman intensity in the high-wavenumber region by the method. Experimentally, an ytterbium-doped fiber laser and photonic crystal fiber-based solitons are employed to provide two pulses as the pump and Stokes, respectively, and to perform interpulse stimulation FT-CARS without sophisticated dispersion control devices. The high-wavenumber region and upper-part fingerprint region measurements are demonstrated as examples of flexible measurement. Combined with other rapid scanning techniques, such as resonant scanners or a dual-comb scheme, this interpulse stimulation FT-CARS promises to make the fascinating FT-CARS available for any desired wavenumber region, covering many more realistic scenarios for biomedical, pathological, and environmental research.
1. INTRODUCTION
Broadband coherent anti-Stokes Raman scattering (CARS) spectroscopy has received considerable attention as a nonlinear molecular vibrational spectroscopic technique featuring noninvasiveness and label-free monitoring [1–5]. Compared with other CARS spectroscopic schemes, Fourier-transform CARS [6] (FT-CARS) stands out with high spectral resolution up to the molecular intrinsic bandwidth and the ability to avoid nonresonant background, providing accurate and unflawed Raman information of the measured sample. Moreover, beyond the constraint of low-speed CCD-based spectrometers, FT-CARS offers the possibility to provide broadband spectra with unprecedentedly high refresh rates up to tens of thousands of spectra per second [7–9], which is of huge significance for many applications in need of high-speed acquisition, including in vivo microspectroscopic imaging of large scale [10] and high-throughput microfluidic monitoring [1]. In fact, the superb FT-CARS has already been used in medical and biological research, such as human bone analysis [11] and high-throughput cell sorting [12].
The FT-CARS scheme up to the present has been using a pair of identical ultrabroadband and ultrafast pulses as the excitation field. Such ultrafast pulses induce impulsive stimulated Raman scattering [13], which requires a pulse width shorter than half the molecular vibrational period for efficient stimulation. Also, there is a belief that the requirement of short pulse width relative to the vibrational period is also necessary for the second pulse to probe the vibrational coherence so that the oscillatory information is translated into optical intensity variations to be detected [14,15]. Due to these reasons, there is a constraint on the pulse width relative to molecular vibrational frequency, creating an incentive to exploit even faster pulses. Therefore, FT-CARS has been using sub-20-fs pulses to perform measurement. Furthermore, for efficient excitation of high-energy vibrations at , which corresponds to a period of 11 fs, even few-cycle pulses are required. This problem is more understandable from the perspective of the frequency domain. In CARS, the molecular vibration is excited by the pump and Stokes fields, whose frequency difference equals the molecular vibration frequency. For impulsive stimulation, the pump and Stokes come from the single broad excitation spectrum. Thus, the measured spectral coverage can be approximated to be the autocorrelation of the excitation spectrum. Such a method has the intrinsic difficulty to excite high-frequency molecular vibrations, just like the three-color multiplex CARS scheme [16,17]. It requires a supercontinuum with dispersion well controlled to reach Raman spectrum of high wavenumber, which is nontrivial to realize. Ti:sapphire oscillators providing such ultrabroadband and ultrafast pulses tend to be expensive, bulky, and complex. On the other hand, doped fiber lasers suffer from narrow gain bandwidths, and, therefore, require complicated nonlinearity-based supercontinuum generation and dispersion control to facilitate ultrafast pulse extraction [18]. Even in the few ultrabroadband FT-CARS realizations [19,20], the measurement efficiency in the high-wavenumber region is rather low. In fact, current FT-CARS researches are most efficient at region and can barely reach . However, the Raman region of high wavenumber is also important [14]. In the upper part of the fingerprint region () lie the features of amide groups, and many double bonds, such as C=N, C=O, and C=C, which biological tissues densely contain. The novel bio-orthogonal labels, such as stable isotope and triple-bond functional groups, provide special vibrational features in the silent region () without the influence of other cellular contributions [21,22]. The high-wavenumber region () features the stretching of C-H, N-H, and O-H with a large Raman-scattering cross section. A broadband Raman measurement with high spectral resolution in the high-wavenumber region reveals specific characteristics of biological substances including triglycerides, collagen, and myelin and assists many medical diagnoses [23]. These Raman regions of great interest are often neglected by FT-CARS due to the inherent difficulty for impulsive stimulated Raman scattering to cover high-energy level vibrations. In order for FT-CARS to deliver its fascinating performance in many more diverse application scenarios, it needs to have higher flexibility in the Raman measurement region.
In this paper, we introduce interpulse stimulation FT-CARS, which breaks the sub-20-fs constraint and provides a more flexible Raman region by using two broadband pulses of different center wavelengths. We theoretically describe the physical mechanism of interpulse stimulation FT-CARS and prove that the signal origin of FT-CARS does not necessarily require the excitation pulse width less than half the molecular vibration periods. Simulation shows an orders-of-magnitude improvement of Raman intensity in the high-wavenumber region by the method. Exploiting the transform-limited nature of solitons, interpulse stimulation FT-CARS is realized without complicated dispersion control for ultrabroad spectral components. Two pulses are used to excite and measure high-frequency vibrations at , corresponding to a molecular vibrational period of . Upper fingerprint region measurement is also performed to demonstrate the flexibility of the scheme. The interpulse stimulation FT-CARS offers a flexible measurement region, whereas, maintaining the excellent virtues of FT-CARS, extending it to a much broader scope of useful applications.
Sign up for Photonics Research TOC. Get the latest issue of Photonics Research delivered right to you!Sign up now
2. THEORETICAL DESCRIPTION
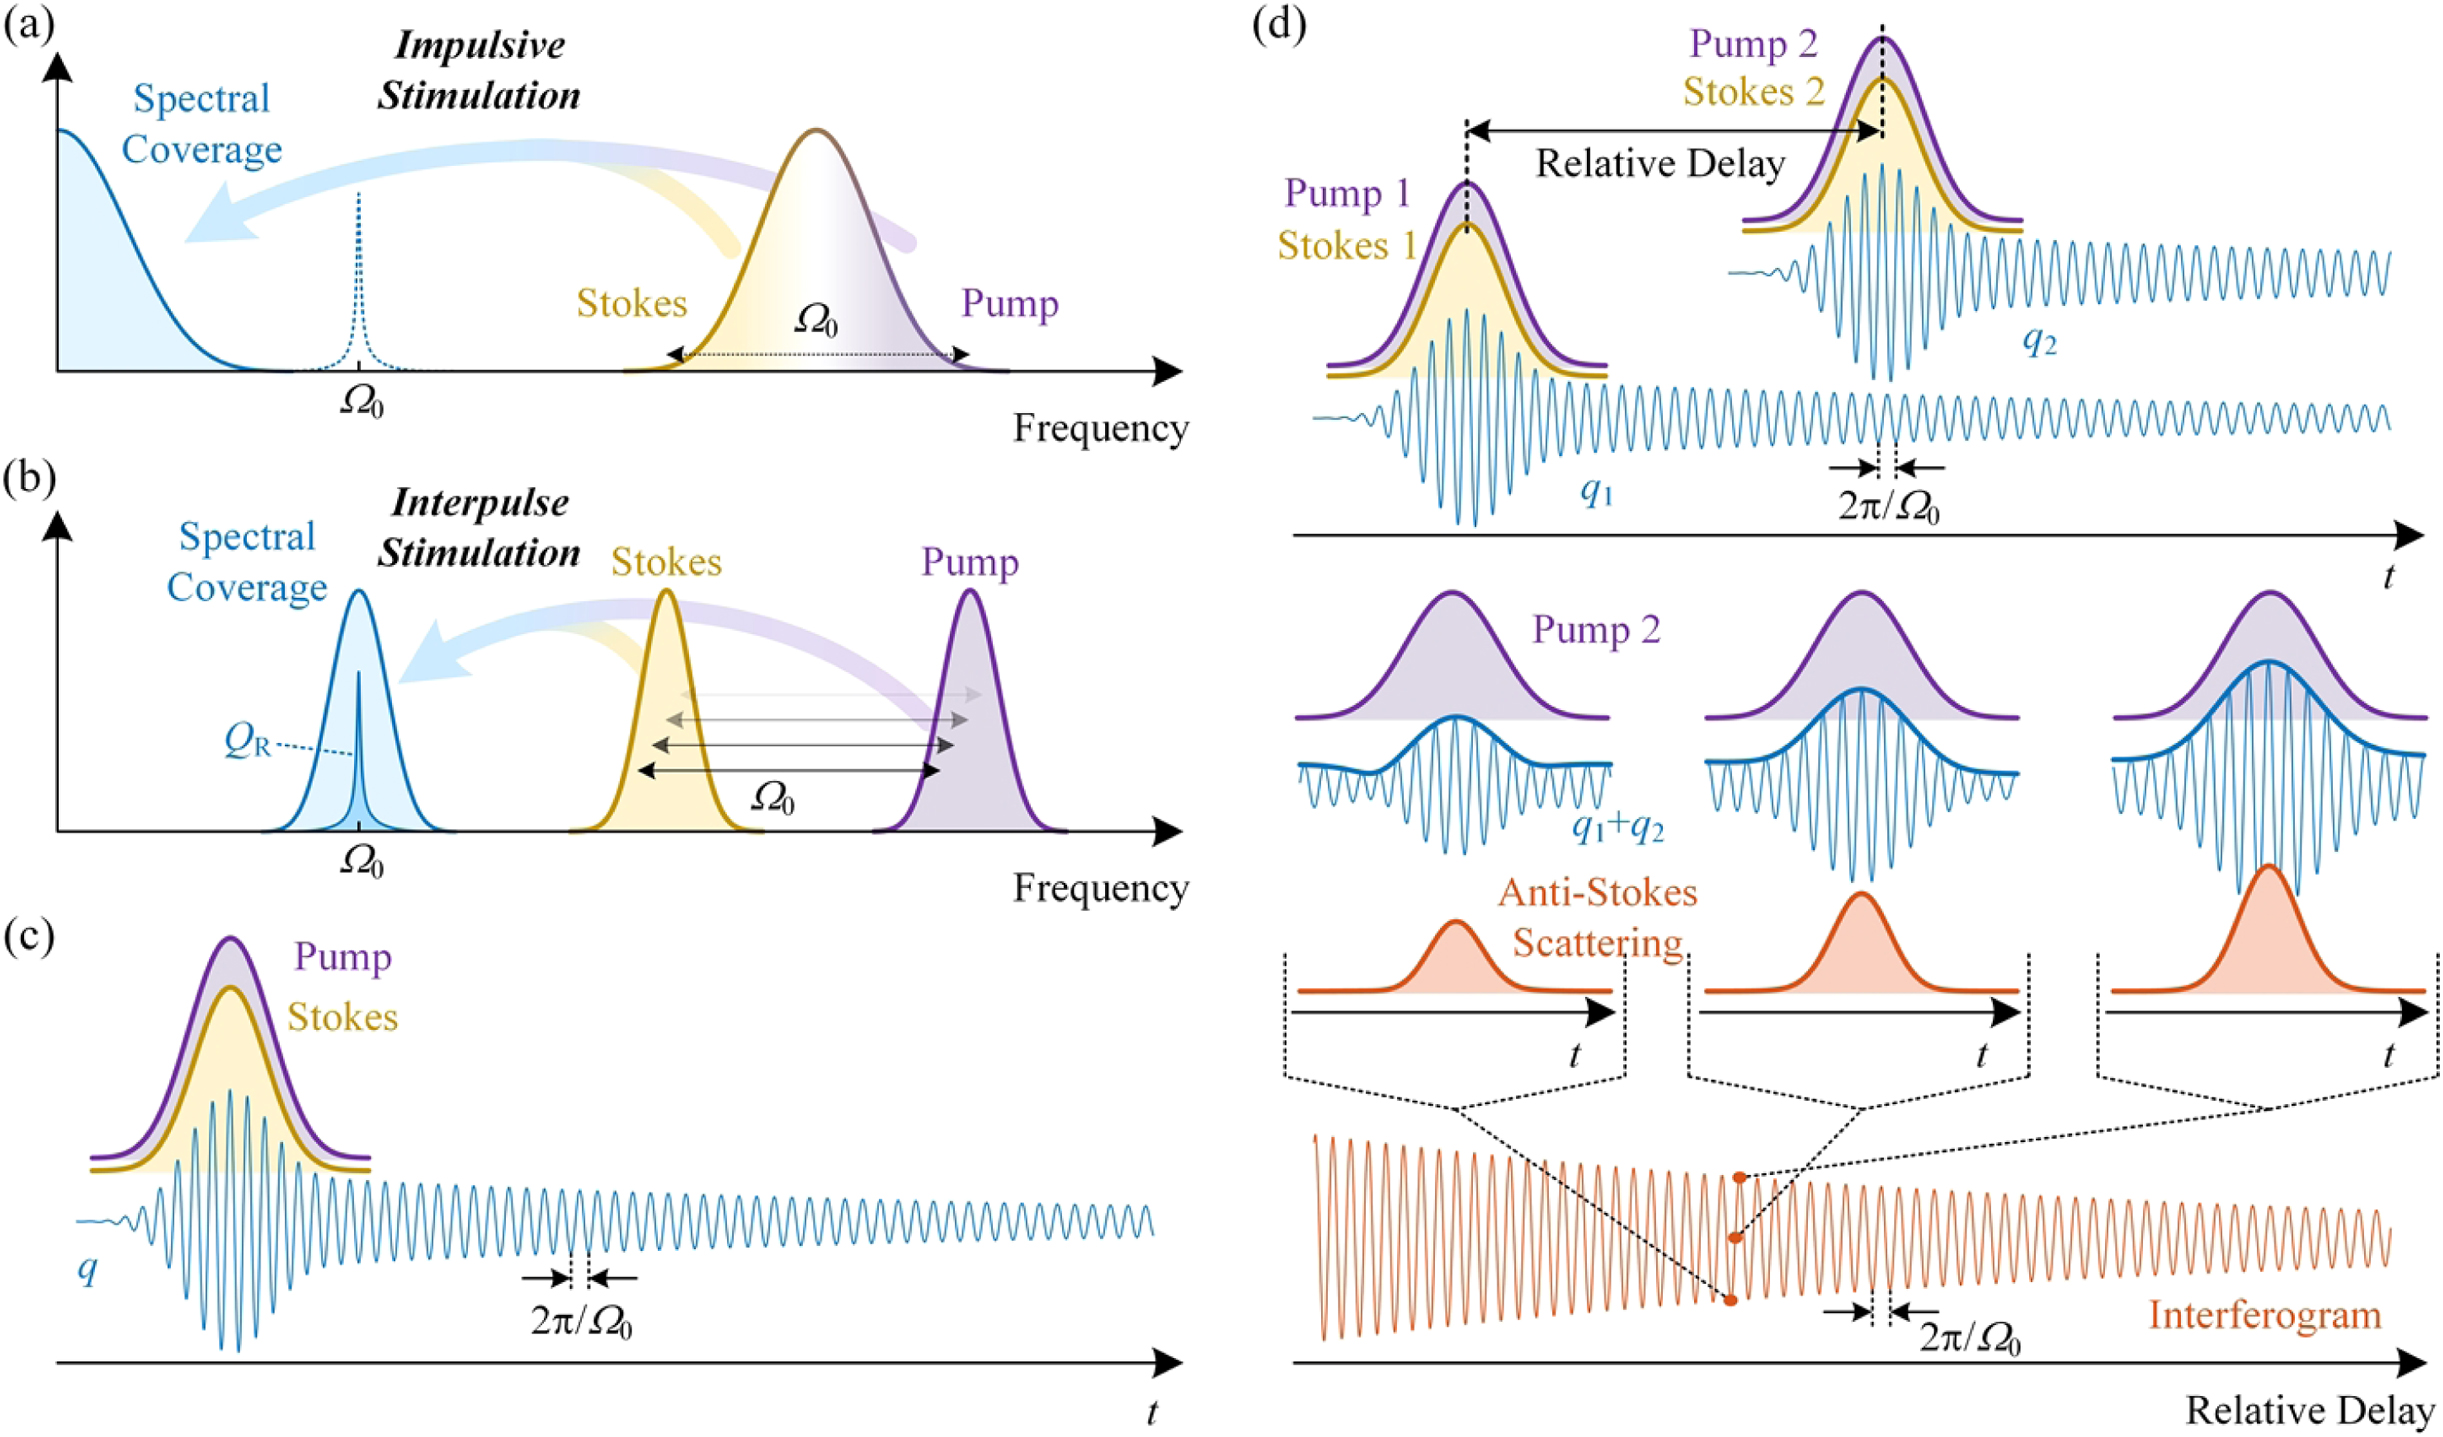
Suppose the pump and Stokes fields in the frequency domain are defined as and , respectively; in general, the CARS process can be described by the following equations [24]: where is the third-order nonlinear susceptibility, is the molecular vibrational coherence, and is the anti-Stokes scattering. Equation (1) describes the Raman excitation process where the vibrational coherence is excited by the combination of the pump and Stokes. Equation (2) describes the interaction between the probe (here degenerate with the pump) and the vibrational coherence, which leads to the anti-Stokes scattering. The intensity of this Raman scattering can be detected with the help of a short-pass filter to eliminate the fundamental fields. The third-order nonlinear susceptibility includes two parts of the contribution, the nonresonant (NR) and resonant contributions . The nonresonant part leads to four-wave mixing scattering, whereas, the resonant contribution reflects the oscillatory Lorentzian response. For the simplicity of the analysis, suppose the excited scatterers have only one vibrational mode excited in the process, where defines the intensity of the resonant contribution dependent on the concentration of the scatterers and the cross section, is the vibrational frequency, and defines the damping of the vibration. Figure 1(b) depicts this excitation process based on interpulse stimulation where the excited consists of the nonresonant contribution and the resonant contribution . shows spectral coverage of the cross correlation of the pump and Stokes since has a broad feature and can be approximated to be a frequency-independent real constant. Note that both the pump and the Stokes are transform limited to have the largest spectral coverage, which means that they have a constant spectral phase. In this interpulse stimulation, the center wavelengths of the pump and Stokes fields can be easily tuned and varied so that the measurement spectral coverage region can be selected to be the region of interest. Here, the pump and Stokes have a large frequency difference, so the high-frequency vibration is excited, showing the Lorentzian response of .
Figure 1.Comparison of (a) impulsive stimulation and (b) interpulse stimulation in the frequency domain. (c) Interpulse stimulation in the time domain. (d) Principle of interpulse stimulation FT-CARS.
The interpulse stimulation in the time domain is shown as Fig. 1(c). Here, the transform-limited pump and Stokes pulses coincide in time, stimulating the time-domain version of molecular coherence . The resonant contribution shows the long-lasting oscillatory and decaying features, which is the time-domain Lorentzian response. The nonresonant contribution , on the other hand, is an instantaneous response so that it only appears at the moment when the pump and Stokes exist, leading to a large amplitude of at this moment.
In comparison, for impulsive stimulation, only one broadband pulse provides both the pump and Stokes as shown in Fig. 1(a). The calculation of the spectral coverage is then modified to be the autocorrelation of the spectrum of the pulse. Therefore, the spectral coverage is concentrated on the low-frequency section. For a high-energy molecular vibration of the frequency, it is difficult to obtain a transform-limited and ultrabroadband pulse spanning the breadth of to excite this molecular coherence. In other words, only the very edges of the pulse spectrum, which is only a very small amount of the total, contribute to the high-frequency coherence, leading to a low excitation efficiency in this region. Comparatively, for interpulse stimulation, with the center wavenumber difference of the pump and Stokes close to , most of their pulse energy is used for the excitation of this coherence. Therefore, it has a high excitation efficiency in the region of interest for interpulse stimulation.
The difference between the two stimulation methods can also be recognized in the time domain. For impulsive stimulation, due to the Fourier relationship between the frequency-domain spectrum and the time-domain pulse width, it is equivalent that the pulse width needs to be shorter than half the molecular vibrational period to impulsively excite the vibrational coherence, hence the name of impulsive stimulation. Suppose the molecular vibrational mode is at in the high-wavenumber region. It has a vibrational period of 11 fs so that a pulse as short as 5.5 fs is needed to efficiently stimulate this vibrational coherence. Such ultrafast pulses are still difficult to obtain and require sophisticated setup geometry. As for interpulse stimulation, the pump and Stokes are two individual pulses. From the perspective of the Fourier relationship, the excited molecular vibrational period is inversely proportional to the frequency difference of the two pulses, whereas, the pulse widths are inversely proportional to the spectral width of their respective spectra. Therefore, the ultrafast property is not needed for a high-frequency mode excitation. Note that in Fig. 1(c), the pulse widths can be much larger than the molecular vibrational period.
Although the interpulse stimulation shows superiority in flexible molecular coherence stimulation without the need of ultrafast pulses, the coherence still needs to be converted into optical intensity so that it can be detected and analyzed. In conventional impulsive stimulation FT-CARS, a second but identical pulse probes the phase of the coherence. The intuitive idea is that the pulse needs to be shorter than half the vibrational period so that it is sensitive to the phase variation. For interpulse stimulation FT-CARS to be feasible, the relatively long pulses also need to have the ability to probe the phase of the coherence.
Two pump–Stokes pairs are used for two interpulse stimulations in interpulse stimulation FT-CARS as shown in Fig. 1(d). When the two pairs are well separated in the time domain, but not so far apart that the first coherence decays to be negligible, the two pairs each excite one molecular coherence and . The combined coherence then shows the interference pattern with respect to the relative delay. In fact, Eq. (2) can be Fourier transformed to be
Equation (4) shows the pump-coherence interaction in the time domain, and that the intensity of the anti-Stokes scattering is proportional to the product of the pump and coherence intensities. For a specific relative delay, the detected intensity is the integration intensity of anti-Stokes scattering,
Under the replicas-far-apart assumption described above, the anti-Stokes scattering from pump 1 and is independent of the relative delay of the replicas. It only leads to a DC component to the final signal. Therefore, we can only consider the anti-Stokes scattering from pump 2 and . Since the intensity of pump 2 stays unchanged, the anti-Stokes scattering intensity shows the same evolution trend as that of the interfered coherence. Therefore, as the increase in the relative delay, the long-lasting vibrational and decaying features of the coherence induced by the first pulse pair are mapped to the detected intensity evolution, which is the interferogram measured. Thus, although the pump-Stokes pair has a large pulse width compared with the vibrational period, it is also able to retrieve the coherence phase. In this way, we can resolve the time-domain Raman coherence of the detected sample. Finally, the Fourier analysis of the interferogram retrieves the CARS spectrum.
3. SIMULATION
In order to quantitatively show the high excitation efficiency of the interpulse stimulation FT-CARS scheme, a simulation of the overall FT-CARS process is performed based on the basic CARS equations of Eqs. (1) and (2). Here, for the interpulse stimulation FT-CARS, the pump and Stokes fields of the two replicas are defined in the frequency domain with different temporal relative delays transferred into the spectral phase shift through the properties of FT. The spectral intensities of the pump and Stokes are defined as Fig. 2(a) with the pump pulses of 2 nJ and the Stokes of 0.5 nJ. The molecular vibrations are assumed to be a series of equal-amplitude, equal-damping vibrations with a frequency spacing of in the high-wavenumber region. The assumed spectrum, i.e., , is shown in Fig. 2(c) as the dark black line. The nonresonant contribution is also considered with the amplitude set to be half the molecular vibrational amplitude. The total spectrum in Fig. 2(c) as the light gray line, illustrates the typical distortion of the CARS spectrum due to the existence of nonresonant background: the peaks are slightly shifted to the lower frequency, and the feature on the low-frequency side of each peak is less sharp. Thanks to the time-resolving ability of FT-CARS, it can eliminate the nonresonant contribution by exploiting the temporal characteristics of resonant and nonresonant signals. With the intensity of anti-Stokes scattering of different relative delays calculated according to Eqs. (1) and (2), the resonant part of the final interferogram is Fourier transformed to retrieve the final nonresonant-background-free spectrum as shown in Fig. 2(d). It can be seen that the retrieved spectrum resembles the ideal resonant spectrum , only that the peak intensities are modulated by the spectral coverage envelope shown as the dotted line. For impulsive stimulation FT-CARS simulation, the spectrum of the excitation pulses is assumed to be a supercontinuum spanning over as shown in Fig. 2(b). The pulse energy is the same as the total pulse energies of the interpulse scheme, i.e., 2.5 nJ. Here, the simulation calculation equations are similar to Eqs. (1) and (2) with the pump and Stokes spectra replaced by the overall pulse spectrum. Also, a proportion of the anti-Stokes scattering overlaps with the excitation field in frequency, which cannot be isolated and detected experimentally. Therefore, an ideal filter with cutoff wavelength at 880 nm is assumed to retain only the shorter-wavelength anti-Stokes scattering and calculate the intensity of this proportion, which leads to a certain amount of unavoidable scattering energy waste. Finally, the retrieved spectrum of the impulsive stimulation FT-CARS is shown in Fig. 2(d). Note that in this region of interest, the CARS spectral intensity of interpulse stimulation FT-CARS is much larger than the impulsive one. This is because in impulsive stimulation FT-CARS, only the high- and low-frequency components at the edges of the pulse spectrum contribute to the high-wavenumber region vibrations. In interpulse stimulation FT-CARS, most pulse energy contributes to the vibrations since its combination of the pump and Stokes always has a high-frequency difference to excite the assumed high-energy modes. For the spectral peak at , the simulation shows a 70-fold difference between the two methods, indicating the high efficiency for the interpulse stimulation FT-CARS method.
Figure 2.Simulated comparison of the spectral coverage of interpulse stimulation FT-CARS and impulsive stimulation FT-CARS. (a) Excitation spectrum of the interpulse stimulation scheme. (b) Excitation spectrum of the impulsive stimulation scheme. (c) Assumed spectrum without (dark black) and with (light gray) nonresonant background of the simulated sample. (d) Retrieved spectra of the interpulse and impulsive stimulation FT-CARS.
The setup of the interpulse stimulation FT-CARS spectrometer is shown in Fig. 3. An ytterbium-doped (Yb-doped) fiber laser with a repetition rate of provides pulses at . An HWP and a PBS divide the laser output into two parts, one as the pump and the other as the fundamental field for the PCF to provide solitons at as the Stokes. The length of the PCF (NKT Photonics SC-5.0-1040-PM) is 1.93 m. The pump and Stokes are combined and directed into a Michelson interferometer to provide two identical pairs of pump and Stokes pulses with changing relative delay. Then the two pump-Stokes pairs are sent into a microscope. A pair of objective lenses are used for laser focusing and CARS emission collection. A pair of lenses and a delay line are applied for the superposition of the pump and Stokes both in space and in time at the focusing spot of the objective lens. The total averaged power of the pump after the objective lens is , and that of the Stokes is . The excitation fields are removed by a short-pass optical filter, and the CARS signal is detected by an APD (Thorlabs, AM120). The APD signal is digitized by a 10-bit oscilloscope. A 632-nm cw laser is applied for the relative delay calibration of the Michelson interferometer.
The spectra of the pump and Stokes are shown in Figs. 4(a) and 4(b), respectively. They constitute a measuring region in the high-wavenumber region. The interferometric autocorrelation of the pump pulses is shown in Fig. 4(c). The fringes with an period result from the interference of the pulses during autocorrelation. The fringes last through the entire trace of the pulse duration, suggesting the pulse is near transform limited, and the linear chirp is hardly involved. The side-lobe fringes on either side also imply the existence of a small amount of higher-order dispersion, which is not fully compensated for by the grating pair inside the Yb-doped fiber laser. Similarly, the interferometric autocorrelation of the Stokes in Fig. 4(d) shows the lack of fringes at the edges of the trace, indicating a small amount of linear chirp, which is induced by the transmitted optical components. Also, the lack of side lobes suggests that there is little higher-order dispersion involved, demonstrating the high coherence of the soliton pulses. The Gaussian fitted autocorrelation traces are shown as the dark lines, suggesting a pulse width of 95 fs for the pump and 151 fs for the Stokes. Both of them are much broader than the traditional used sub-20-fs pulses for interferometric FT-CARS.
Figure 4.Spectra of the (a) pump and (b) Stokes; autocorrelation of the (c) pump and (d) Stokes.
As the scanning of the Michelson interferometer and therefore the relative delay of the two pump-Stokes replicas, the detected anti-Stokes scattering intensity is shown in Fig. 5(a) with DMSO as the sample. Note that in the vicinity of zero delay, much stronger CARS intensity is detected, resulting from the interference of the pulse replicas as well as the nonresonant response. On the other hand, the intensity trace away from zero delay resembles the oscillatory molecular response. The oscillating period is , corresponding to the molecular feature at of DMSO in the high-wavenumber region. In traditional impulsive stimulation, it needs a sub-6-fs pulse, which requires a much more sophisticated laser and demanding setup geometry, to efficiently excite such high-frequency vibrations. Here based on interpulse stimulation, two pulses are enough for such excitation. The nonresonant-background-free CARS spectrum can be retrieved by applying a proper window to select the effective resonant response and performing fast Fourier transform (FFT) with it. The result is shown in Fig. 5(b). The corresponding spectral resolution is , and the signal-to-noise ratio (SNR) of the unaveraged spectrum is . Limited by the scanning speed of the mechanical motorized stage, which is used as the scanning arm in the Michelson interferometer, the single spectrum acquisition time is .
Figure 5.(a) Unaveraged interferogram of DMSO rescaled to relative delay. (b) Unaveraged FT-CARS spectrum of DMSO in the high-wavenumber region.
Furthermore, the unaveraged nonresonant-background-free interpulse stimulation FT-CARS spectrum of methanol is shown in Fig. 6(a) on the top as the shaded area, whereas, its 20 spectra averaged counterpart is shown on the middle. The SNR of the methanol spectra is improved from to by averaging. The two vibrational modes at and are evident, in good agreement with the spontaneous Raman spectrum shown on the bottom of Fig. 6(a). To display the effectiveness of the nonresonant background removing capacity of the interpulse stimulation FT-CARS system, the full spectra from FFT of the interferogram including relative delay close to zero are also retrieved and shown in Fig. 6(a) as the unshaded lines for comparison. The time-resolving feature of FT-CARS confines the nonresonant contribution to relative delay close to zero. Therefore, the full spectra combine the contribution of both resonant and nonresonant signals. In the full spectra, evident spectral distortion from nonresonant background is revealed with each peak shifted to the low-frequency side by about 2 to compared with the background-free spectra. Moreover, the upper-part fingerprint region measurement is also performed to demonstrate the flexibility of measurement region of the interpulse stimulation FT-CARS system. The soliton is tuned to be centered at 1285 nm by changing the PCF input power, whereas, all other parameters remain unchanged. The nonresonant-background-free spectral results of the PET sample are shown in Fig. 6(b) as the shaded areas. The SNR is improved from to by the averaging of 20 spectra. The measured spectra display the same spectral features in the upper fingerprint region at and as the spontaneous Raman reference on the bottom. Similarly, nonresonant-background-affected full spectra are also shown in Fig. 6(b) as the unshaded lines. The peaks are shifted to the low-frequency side by about 2 to . The experimental results verify the feasibility, nonresonant background removing capability, and measurement flexibility of the interpulse stimulation FT-CARS spectroscopy.
Figure 6.Measured interpulse stimulation FT-CARS spectra of (a) methanol in the high-wavenumber region and (b) polyethylene terephthalate (PET) in the upper part of the fingerprint region without averaging (top) and with 20 spectra averaged (middle). Both resonant spectra (shaded areas) and nonresonant-background-affected spectra (unshaded lines) are illustrated. The Raman spectra are shown (bottom) as reference. (c) Quantitative analysis of DMSO in water together with the quadratic fit with .
In addition, to characterize the sensitivity of the interpulse stimulation FT-CARS system, the quantitative analysis of DMSO in water is performed. As shown in Fig. 6(c), the peak intensities of DMSO of different concentrations exhibit a quadratic trend, and the quadratic fit has an of 0.984. Considering that the anti-Stokes scattering intensity is proportional to the interfering molecular coherence and, thus, proportional to the product of the amplitudes of and , and that the resonant contributions of and are proportional to molecular concentration, the measured quadratic trend is in agreement with the theoretical description. The result of 0.7 mol/L DMSO, which is 5% in volume, still has an SNR of , indicating a good detection limit of the system.
6. CONCLUSION
In this paper, a proof-of-principle interpulse stimulation FT-CARS spectroscopic scheme was demonstrated with a flexible Raman region by tuning the pump-Stokes center wavelength difference and a relaxation on the necessity of the hard-to-obtain ultrafast pulses. The feasibility of this spectroscopic method was first proved based on the classical CARS interaction equations. It illustrated that pulses with pulse widths larger than half the molecular vibration period were also able to be used to achieve interferometric CARS measurement. With the help of transform-limited solitons from an PCF, flexible interferometric CARS measurements can be realized without any dispersion control elements. The proposed interpulse stimulation FT-CARS bears similarities to spectral focusing CARS [25] in that they both use two separate pump and Stokes pulses as excitation fields for flexible detection, and that both schemes scan relative delay to achieve broadband detection with a single-pixel detector. However, the proposed technique also follows the advantages of FT-CARS, including nonresonant background removing capability and high spectral resolution dependent on molecular decaying time constants. In fact, the current geometry still has a low acquisition speed, limited by the mechanical motorized stage. It can further be combined with rapid Michelson interferometer geometry [9] or dual-comb technology [1,8] with a much higher refresh rate, achieving background-free FT-CARS spectroscopy with high speed and high flexibility. With many more molecular features of biological materials, polymers, and bio-orthogonal tags of high vibration frequency, the novel interpulse stimulation FT-CARS spectroscopy offers a promising tool to delve into these intriguing application scenarios in a flexible, dynamic, and chemically specific manner.