• Acta Optica Sinica
  • Vol. 37, Issue 8, 0828004 (2017)
Zuowei Huang1、*, Feng Liu2, and Guangwei Hu1
Author Affiliations
  • 1 School of Architecture and Urban Planning, Hunan University of Technology, Zhuzhou, Hunan 412000, China
  • 2 School of Geosciences and Information-Physics, Central South University, Changsha, Hunan 410083, China
  • show less
    DOI: 10.3788/AOS201737.0828004 Cite this Article Set citation alerts
    Zuowei Huang, Feng Liu, Guangwei Hu. Improved Method for LiDAR Point Cloud Data Filtering Based on Hierarchical Pseudo-Grid[J]. Acta Optica Sinica, 2017, 37(8): 0828004 Copy Citation Text show less
    Schematic diagram of pseudo-grid. (a) Three-dimensional display; (b) two-dimensional display
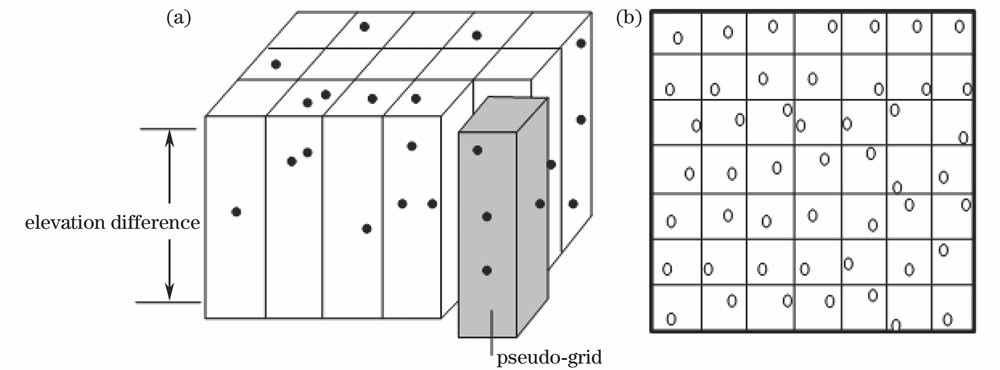
    Fig. 1. Schematic diagram of pseudo-grid. (a) Three-dimensional display; (b) two-dimensional display
    Construction process of pseudo-grid
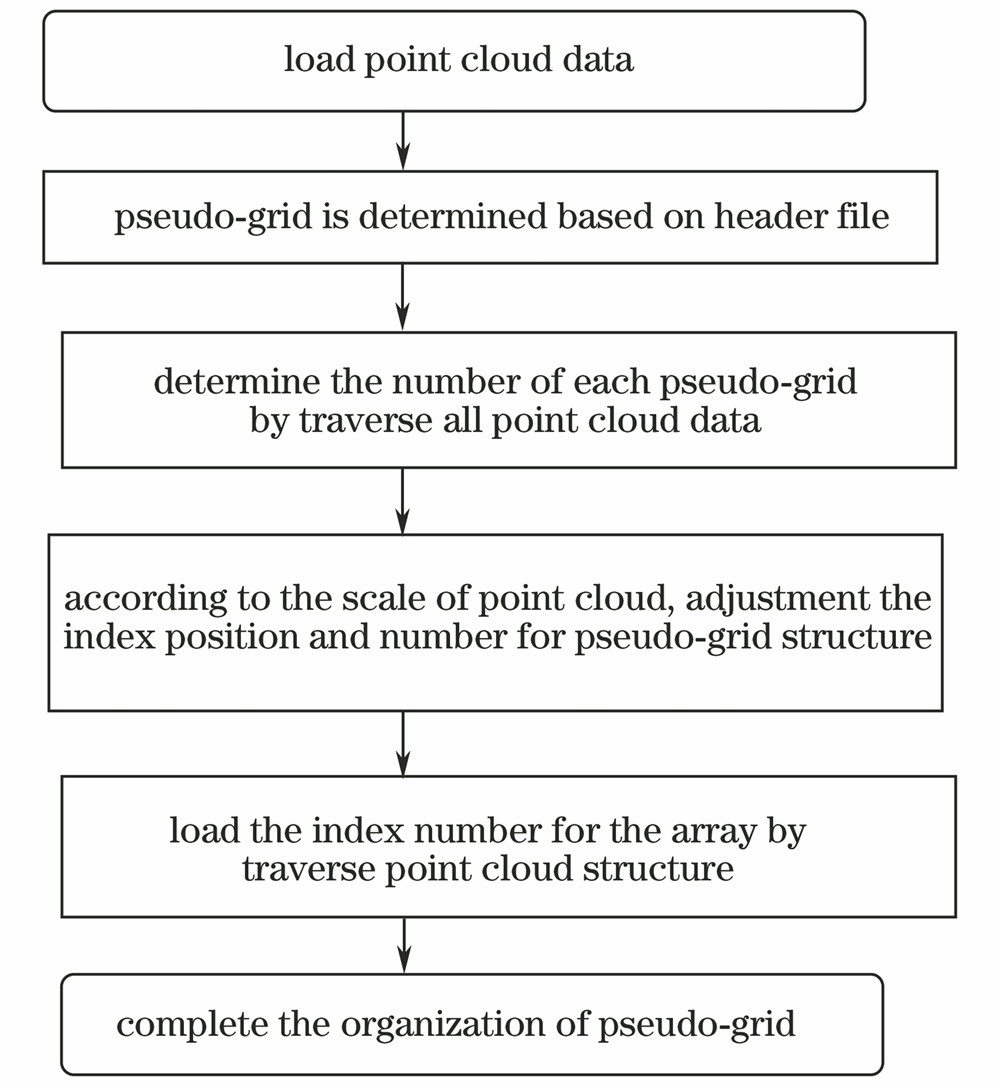
    Fig. 2. Construction process of pseudo-grid
    Flow chart of improved filtering algorithm
    Fig. 3. Flow chart of improved filtering algorithm
    Filtering flow chart based on CUDA
    Fig. 4. Filtering flow chart based on CUDA
    Filtering result of sample 11. (a) DSM of sample data; (b) result after filtering with slope method; (c) result after filtering with the improved method; (d) real DEM provide by ISPRS; (e) error distribution map
    Fig. 5. Filtering result of sample 11. (a) DSM of sample data; (b) result after filtering with slope method; (c) result after filtering with the improved method; (d) real DEM provide by ISPRS; (e) error distribution map
    Comparison of type II error with different algorithms
    Fig. 6. Comparison of type II error with different algorithms
    Comparison of processing time with different algorithms
    Fig. 7. Comparison of processing time with different algorithms
    Experimental data. (a) Original point cloud data; (b) DSM grey-scale map of after meshing
    Fig. 8. Experimental data. (a) Original point cloud data; (b) DSM grey-scale map of after meshing
    Experiment results. (a) Filtering result of this method; (b) filtering result of progressive TIN filtering algorithm; (c) filtering result of slope filtering algorithm; (d) DEM after filtering
    Fig. 9. Experiment results. (a) Filtering result of this method; (b) filtering result of progressive TIN filtering algorithm; (c) filtering result of slope filtering algorithm; (d) DEM after filtering
    DataData 1Data 2Data 3
    SensorALS50-ⅡALS50-ⅡALS60
    Time2012.42012.52012.4
    Altitude /m125012502000
    Number185673267859381623
    Mean point density /m-21.62.53.2
    Coverage /km20.120.170.19
    Table 1. Attributes of filtering data
    NumberMax grid scale /mSlope thresholdStSiSm
    17515201540
    27515251540
    37515202040
    47515151540
    Table 2. Parameters of data filtering
    Experiential dataNumberType I error /%Type II error /%Gross error /%
    Data 1110.565.787.78
    211.235.898.12
    312.355.2310.11
    414.687.4312.35
    Data 219.565.515.88
    210.456.348.12
    313.455.689.34
    415.678.679.58
    Data 3110.346.459.17
    211.577.789.35
    314.565.699.09
    415.674.938.74
    Table 3. Filtering error statistics of three groups data under different parameters
    DataFiltering methodType I error /%Type II error /%Gross error /%Efficiency /s
    Progressive TIN13.587.329.1218.4
    Data 1Slope filtering14.788.569.5611.5
    This method10.565.787.782.3
    Progressive TIN11.854.609.8917.7
    Data 2Slope filtering13.436.7810.6710.4
    This method9.565.515.881.3
    Progressive TIN12.584.4710.0119.7
    Data 3Slope filtering13.457.8912.5611.5
    This method10.346.459.170.9
    Table 4. Comparison table of filtering error and efficiency of different algorithms
    Zuowei Huang, Feng Liu, Guangwei Hu. Improved Method for LiDAR Point Cloud Data Filtering Based on Hierarchical Pseudo-Grid[J]. Acta Optica Sinica, 2017, 37(8): 0828004
    Download Citation