
Ming Wang, Hao Feng, Zhou Sha, Lipu Du. Characteristics of Soil Vibration Propagation Based on Phase Sensitive Optical Time Domain Reflectometers[J]. Laser & Optoelectronics Progress, 2023, 60(19): 1906003
- Laser & Optoelectronics Progress
- Vol. 60, Issue 19, 1906003 (2023)
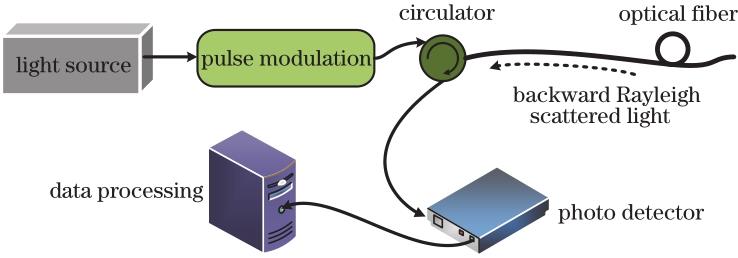
Fig. 1. Schematic diagram of φ-OTDR system

Fig. 2. Schematic diagram of internal structure of φ-OTDR integrated system
Fig. 3. Experimental site. (a) Experimental optical path; (b) position of sensing optical cable and experiment; (c) edge auxiliary positioning mark; (d) optical fiber; (e) internal structure of GYTA53 optical cable; (f) internal structure of GJA optical cable
Fig. 4. Comparison of response signals under action of vibration signals
Fig. 5. Variation of sensitivity with sensing distance. (a) Humidity 1; (b) humidity 2; (c) humidity 3; (d) humidity 4; (e) humidity 5
Fig. 6. Sensitivity comparison among different humidities. (a) Ball-0.8 m; (b) ball-0.3 m; (c) shovel; (d) motor
Fig. 7. Curves of response signal of GYTA53. (a) Time domain-static state; (b) frequency domain-static state; (c) time domain-impact state; (d) frequency domain-impact state
Fig. 8. Energy distribution of each frequency band under two states. (a) Ball-0.8 m; (b) ball-0.3 m; (c) shovel; (d) motor
Fig. 9. Distribution graphs of
Fig. 10. Parameter distributions of two states. (a)
Fig. 11. Changes of parameters of continuous signal. (a)
Fig. 12. Values of
Fig. 13. Example of suspected vibration point signal. (a) Vibration point signal; (b), (c), (d) non-vibration point signals
|
Table 1. Water content and density of different soil environments
|
Table 2. Judgment results of two methods at a distance of 1 m under dry soil conditions
|
Table 3. Summary of experimental results in Table 2
|
Table 4. Comparison of judgment results under various working conditions


Set citation alerts for the article
Please enter your email address

© Copyright 2018-2021 | Chinese Laser Press. All Rights Reserved 沪ICP备15018463号-20