• Laser & Optoelectronics Progress
  • Vol. 58, Issue 7, 0718001 (2021)
Qinyuan Deng, Qingqing Huang*, Jie Hou, Yan Zhang, Fei Xiong, and Junhua Chen
Author Affiliations
  • School of Automation, Chongqing University of Posts and Telecommunications, Chongqing 400065, China
  • show less
    DOI: 10.3788/LOP202158.0718001 Cite this Article Set citation alerts
    Qinyuan Deng, Qingqing Huang, Jie Hou, Yan Zhang, Fei Xiong, Junhua Chen. Analysis and Restriction About Accumulated Phase Error in Spacial Frequency-Domain Algorithm for White-Light Interferomety[J]. Laser & Optoelectronics Progress, 2021, 58(7): 0718001 Copy Citation Text show less
    Schematic of signal acquisition for white-light interferometry
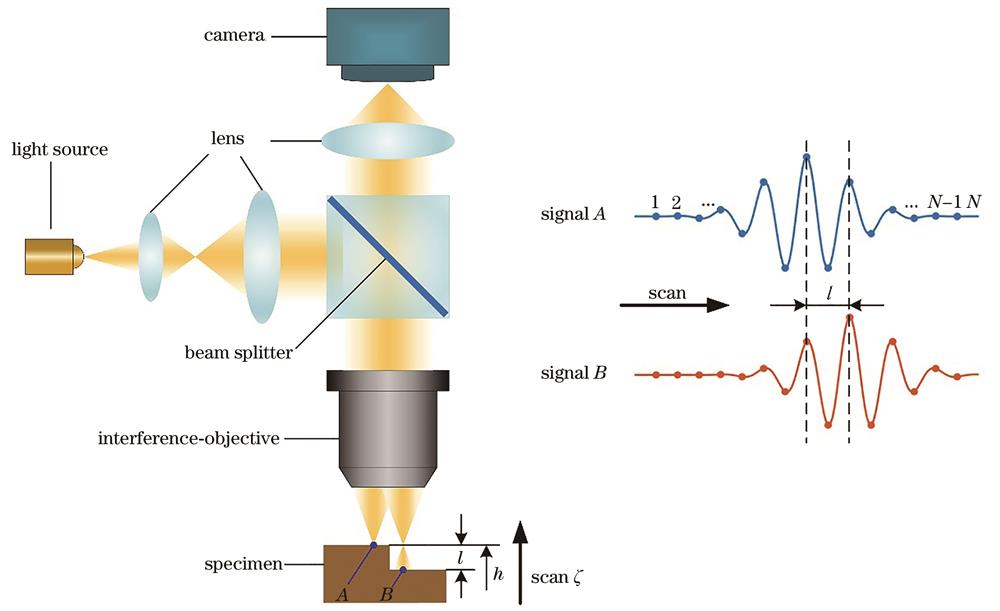
    Fig. 1. Schematic of signal acquisition for white-light interferometry
    Schematic of traditional FDA algorithm
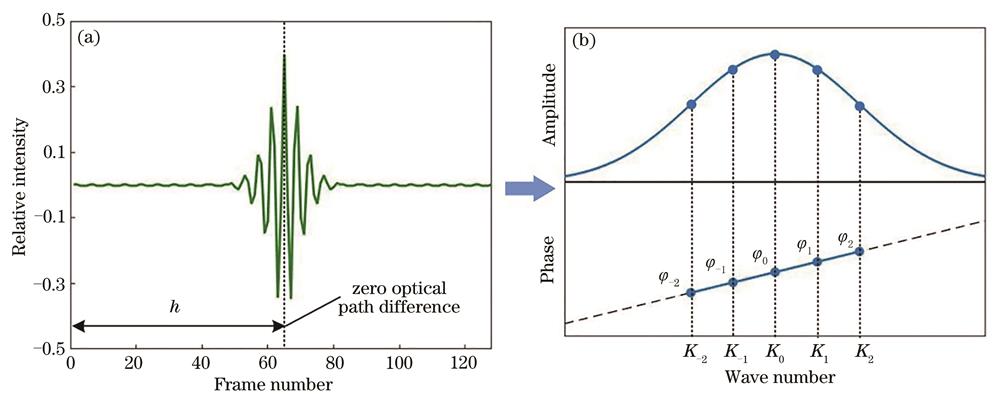
    Fig. 2. Schematic of traditional FDA algorithm
    Schematic of phase difference for discrete sampling interference signal analysis
    Fig. 3. Schematic of phase difference for discrete sampling interference signal analysis
    Schematic of ESAA
    Fig. 4. Schematic of ESAA
    Simulation sample and interferograms. (a) Original surface; (b) surface with a tilted dautm; (c) interferograms
    Fig. 5. Simulation sample and interferograms. (a) Original surface; (b) surface with a tilted dautm; (c) interferograms
    Simulation results. (a)(b) Surface topography and residual error measured by traditional FDA method; (c)(d) surface topography and residual error measured by ESAA method
    Fig. 6. Simulation results. (a)(b) Surface topography and residual error measured by traditional FDA method; (c)(d) surface topography and residual error measured by ESAA method
    Comparison of cross-section profiles. (a) Traditional FDA method; (b) ESAA method
    Fig. 7. Comparison of cross-section profiles. (a) Traditional FDA method; (b) ESAA method
    Experiment setup
    Fig. 8. Experiment setup
    Interferograms. (a) Grating structure; (b) spherical structure
    Fig. 9. Interferograms. (a) Grating structure; (b) spherical structure
    Grating structure measurement results. (a)(b) Surface topography containing the same inclined datum, measured by traditional FDA method and ESAA method; (c) inclined datum extracted from Fig. (b); (d)(e) surface topography after removing inclined datum from Fig. (a) and (b), respectively; (f) residual error between Fig. (d) and (e)
    Fig. 10. Grating structure measurement results. (a)(b) Surface topography containing the same inclined datum, measured by traditional FDA method and ESAA method; (c) inclined datum extracted from Fig. (b); (d)(e) surface topography after removing inclined datum from Fig. (a) and (b), respectively; (f) residual error between Fig. (d) and (e)
    Cross-section profile for grating structure. (a) Cross-section profile measured by traditional FDA method; (b) cross-section profile measured by ESAA method; (c) cross-section profile of residual error; (d) cross-section profile measured by stylus profiler
    Fig. 11. Cross-section profile for grating structure. (a) Cross-section profile measured by traditional FDA method; (b) cross-section profile measured by ESAA method; (c) cross-section profile of residual error; (d) cross-section profile measured by stylus profiler
    Spherical structure measurement results. (a) Traditional FDA method; (b) ESAA method; (c) residual error between Fig. (a) and (b); (d)-(f) cross-section profiles of Fig. (a)-(c) at 250th row, respectively
    Fig. 12. Spherical structure measurement results. (a) Traditional FDA method; (b) ESAA method; (c) residual error between Fig. (a) and (b); (d)-(f) cross-section profiles of Fig. (a)-(c) at 250th row, respectively
    Measurement results after wavelet denoising. (a) Grating structure surface topography; (b) spherical structure surface topography; (c) cross-section profile of grating structure; (d) cross-section profile of spherical structure
    Fig. 13. Measurement results after wavelet denoising. (a) Grating structure surface topography; (b) spherical structure surface topography; (c) cross-section profile of grating structure; (d) cross-section profile of spherical structure
    AlgorithmMean valueμPV valueΔStandard deviation σ
    FDA2.6×10-31.1000.290
    ESAA-7.2×10-50.0540.015
    Table 1. Residual analysis for two simulation results
    MethodStep 1Step 2Step 3Step 4Average
    ESAA125.43134.69124.04126.21127.59
    Stylus profiler131.35129.32131.98131.99131.16
    Table 2. Step height of grating structure
    Mean value PV value ΔStandard deviation σ
    -0.0970.970.18
    Table 3. Residual analysis for spherical structure
    Qinyuan Deng, Qingqing Huang, Jie Hou, Yan Zhang, Fei Xiong, Junhua Chen. Analysis and Restriction About Accumulated Phase Error in Spacial Frequency-Domain Algorithm for White-Light Interferomety[J]. Laser & Optoelectronics Progress, 2021, 58(7): 0718001
    Download Citation