
Shaodi Jing, Lingjuan Yu, Yuehong Hu, Zezhou Yang, Zhongliang Lu, Xiaochun Xie. Semantic Segmentation of Synthetic Aperture Radar Images Based on U-Net and Capsule Network[J]. Laser & Optoelectronics Progress, 2021, 58(20): 2010009
- Laser & Optoelectronics Progress
- Vol. 58, Issue 20, 2010009 (2021)
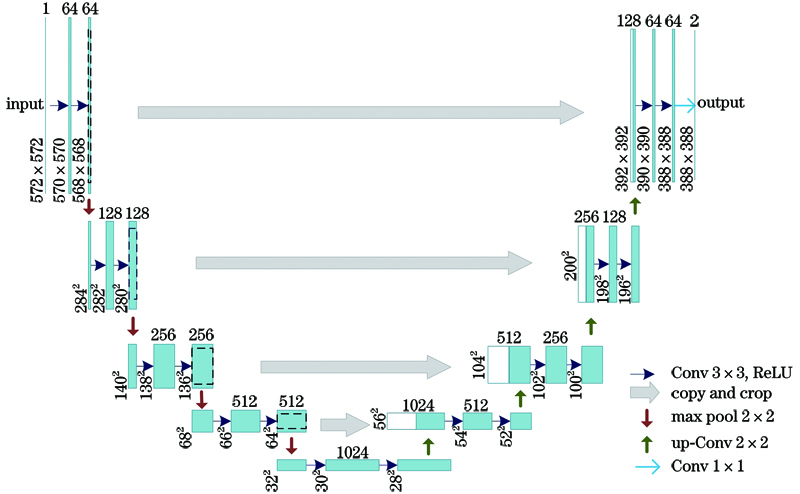
Fig. 1. Structure and parameters of the U-Net
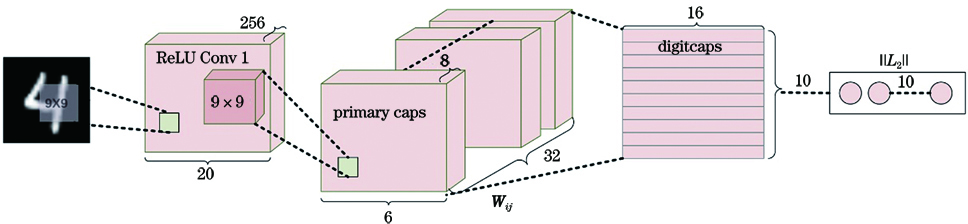
Fig. 2. Structure and parameters of the capsule network
Fig. 3. Network based on U-Net and capsule network for semantic segmentation of SAR image
Fig. 4. San Francisco Bay data. (a) RGB image; (b) label
Fig. 5. Part of training samples in the San Francisco Bay data set
Fig. 6. Oberpfaffenhofen data. (a) RGB image; (b) label
Fig. 7. Part of training samples in the Oberpfaffenhofen data set
Fig. 8. Segmentation results of different methods on the San Francisco Bay data set. (a) Method 1; (b) method 2; (c) method 3; (d) method 4
Fig. 9. Segmentation results of different methods on the Oberpfaffenhofen data set. (a) Method 1; (b) method 2; (c) method 3; (d) method 4
|
Table 1. Segmentation performance of different methods on the San Francisco Bay data set unit: %
| ||||||||||||||||||||||||||||
Table 2. Percentage improvement of the segmentation performance (San Francisco Bay data set) unit: %
|
Table 3. Training time of different methods on the San Francisco Bay data set
|
Table 4. Segmentation performance of different methods on the Oberpfaffenhofen data set unit: %
| ||||||||||||||||||||||||||||
Table 5. Percentage improvement of the segmentation performance (Oberpfaffenhofen data set) unit: %
|
Table 6. Training time of different methods on the Oberpfaffenhofen data set

Set citation alerts for the article
Please enter your email address
© Copyright 2018-2021 | Chinese Laser Press. All Rights Reserved 沪ICP备15018463号-20