• Matter and Radiation at Extremes
  • Vol. 6, Issue 1, 014402 (2021)
S. N. Ryazantsev1、2、a), I. Yu. Skobelev1、2, E. D. Filippov2、3, A. S. Martynenko2, M. D. Mishchenko1、2, M. Krůs4, O. Renner4、5、6, and S. A. Pikuz1、2
Author Affiliations
  • 1National Research Nuclear University MEPhI (Moscow Engineering Physics Institute), Kashirskoe Shosse 31, 115409 Moscow, Russia
  • 2Joint Institute for High Temperatures of the Russian Academy of Sciences, Izhorskaya 13 Bldg 2, 125412 Moscow, Russia
  • 3Federal Research Center Institute of Applied Physics of the Russian Academy of Sciences, 46 Ulyanov Str., 603950 Nizhny Novgorod, Russia
  • 4Laser Plasma Department, Institute of Plasma Physics of the CAS, Za Slovankou 1782/3, Libeň, 182 00 Prague, Czech Republic
  • 5Department of Radiation and Chemical Physics, Institute of Physics of the CAS, Na Slovance 1999/2, 182 21 Prague, Czech Republic
  • 6ELI-Beamlines, Institute of Physics of the CAS, Za Radnicí 835, 252 41 Dolní Břežany, Czech Republic
  • show less
    DOI: 10.1063/5.0019496 Cite this Article
    S. N. Ryazantsev, I. Yu. Skobelev, E. D. Filippov, A. S. Martynenko, M. D. Mishchenko, M. Krůs, O. Renner, S. A. Pikuz. Precise wavelength measurements of potassium He- and Li-like satellites emitted from the laser plasma of a mineral target[J]. Matter and Radiation at Extremes, 2021, 6(1): 014402 Copy Citation Text show less
    Radiation spectrum of KAlSi3O8 plasma in x-ray wavelength range calculated using steady-state approximation for electron temperature Te = 1000 eV and electron density Ne = 1021 cm−3. Intensity vs nλ is shown for reflection order n = 1–5 of diffraction crystals (each order is associated with its own color).
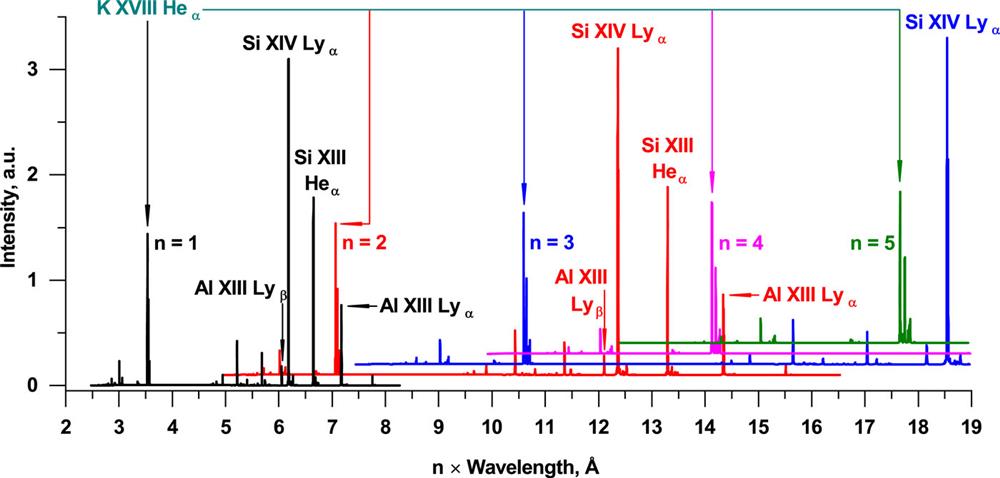
    Fig. 1. Radiation spectrum of KAlSi3O8 plasma in x-ray wavelength range calculated using steady-state approximation for electron temperature Te = 1000 eV and electron density Ne = 1021 cm−3. Intensity vs is shown for reflection order n = 1–5 of diffraction crystals (each order is associated with its own color).
    Spectrum of radiation emitted by KAlSi3O8 plasma in wavelength range of (a) 5.8–7.2 Å and (b) 11.6–15.1 Å calculated for conditions from Fig. 1. Intensity vs nλ is shown for reflection order n = (a) 1 and 2 and (b) 2 and 4. Each order is associated with its own color.
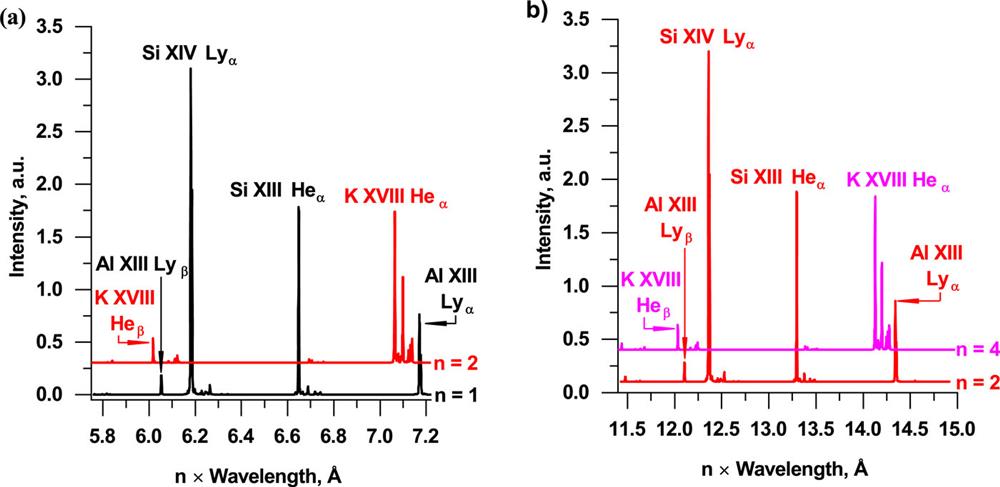
    Fig. 2. Spectrum of radiation emitted by KAlSi3O8 plasma in wavelength range of (a) 5.8–7.2 Å and (b) 11.6–15.1 Å calculated for conditions from Fig. 1. Intensity vs is shown for reflection order n = (a) 1 and 2 and (b) 2 and 4. Each order is associated with its own color.
    Temporal dependencies of intensities of spectral lines emitted by Al, Si, and K ions. The curves were obtained using a time-dependent kinetic model for a plasma with electron temperature Te = 1000 eV and Ne = 1021 cm−3. In the initial state, all ions are singly ionized.
    Fig. 3. Temporal dependencies of intensities of spectral lines emitted by Al, Si, and K ions. The curves were obtained using a time-dependent kinetic model for a plasma with electron temperature Te = 1000 eV and Ne = 1021 cm−3. In the initial state, all ions are singly ionized.
    (a) Spectrum of x-ray radiation emitted during irradiation of orthoclase crystal by (600-J, 480-ps) laser pulse. Indicated are the most intense spectral lines corresponding to the radiative transitions in multicharged ions of Si, Al, and K (K spectral lines are observed in the second order of reflection). (b) Enlarged region with three groups of KHeα line satellites corresponding to transitions in Li-like ion K XVII. The upper and lower configurations for each group of satellites are listed in Table I.
    Fig. 4. (a) Spectrum of x-ray radiation emitted during irradiation of orthoclase crystal by (600-J, 480-ps) laser pulse. Indicated are the most intense spectral lines corresponding to the radiative transitions in multicharged ions of Si, Al, and K (K spectral lines are observed in the second order of reflection). (b) Enlarged region with three groups of KHeα line satellites corresponding to transitions in Li-like ion K XVII. The upper and lower configurations for each group of satellites are listed in Table I.
    Line name [transition(s)]λ (mÅ)Δλ (mÅ)
    KHeβ1s3pP111s2S013010.260.6
    KHeα1s2pP111s2S013532.550.6
    KHeinter1s2pP2,131s2S013549.350.6
    q, r (1s2p[P1]2sP21s22sS2)3560.870.6
    a–d (1s2p2P21s22pP2)3565.060.6
    k, j 1s2p2D21s22pP23569.10.6
    Table 1. Measured wavelengths of transitions in He- and Li-like K ions. Li-like satellites are labeled in accordance with notation introduced in Ref. 31.
    S. N. Ryazantsev, I. Yu. Skobelev, E. D. Filippov, A. S. Martynenko, M. D. Mishchenko, M. Krůs, O. Renner, S. A. Pikuz. Precise wavelength measurements of potassium He- and Li-like satellites emitted from the laser plasma of a mineral target[J]. Matter and Radiation at Extremes, 2021, 6(1): 014402
    Download Citation