
S. N. Ryazantsev, I. Yu. Skobelev, E. D. Filippov, A. S. Martynenko, M. D. Mishchenko, M. Krůs, O. Renner, S. A. Pikuz. Precise wavelength measurements of potassium He- and Li-like satellites emitted from the laser plasma of a mineral target[J]. Matter and Radiation at Extremes, 2021, 6(1): 014402
- Matter and Radiation at Extremes
- Vol. 6, Issue 1, 014402 (2021)
Abstract
I. INTRODUCTION
X-ray spectroscopy is used widely for laser plasma diagnostics
For a given ion, a full set of spectroscopic properties can be obtained only by theoretical calculations. However, only an atomic system with one electron has an exact relativistic equation; the spectroscopic characteristics of ions with two or more electrons are obtained using approximate means such as variational methods or perturbation theory, and in neither case are accuracy estimates available a priori to help choose the most suitable calculation method. The only way to estimate the accuracy of the atomic calculations is to compare (i) the energy-level structure obtained using a particular method for a particular ion with (ii) the wavelengths of spectral lines emitted by this ion, a procedure that requires precise spectroscopic measurements.
The past 100 years have seen investigations aimed at observing, identifying, and measuring the wavelengths of spectral lines emitted by highly charged ions. This activity began with pioneering work on vacuum sparks
Since the 1970s, many spectroscopic measurements have also been made using laser facilities that are capable of generating high-intensity laser pulses. Even the moderate (by modern standards) facilities with intensities of no more than 1014 W/cm2 yielded much experimental data on ions with low ionization potential, which exist in plasmas with sub-kiloelectronvolt temperature (e.g., see SPECTR-W3
To obtain highly accurate wavelength measurements, obviously one must know the dispersion curve of any spectrometer being used, and this can be obtained by observing spectral lines with well-known wavelengths, known as reference lines. However, for a plasma of multicharged ions, the available data on x-ray reference lines are quite limited. Despite there being much experimental data on ions in low-charge states, the accuracy of the measured spectral-line wavelengths is either unavailable or so low that one cannot, for example, choose the suitable atomic-characteristic calculations for the investigated ion.
The best candidates as reference lines are the spectral lines of H-like ions. Calculated analytically considering quantum electrodynamics effects (e.g., see Ref.
Herein, we show how to determine with high accuracy the radiative spectrum of He-like K XVIII ions, including dielectronic satellites due to transitions in the Li-like K XVIII ions, by using spectral lines of Al XIII and Si XIV H-like ions as reference lines. Of course, this approach could be implemented for many other He-like ions, and the precisely measured positions of He-like-ion lines could be used as references for investigating ions with more-complicated energy-level structures with ground states corresponding to partially filled L and M shells.
II. OPTIMAL CONDITIONS FOR EXCITATION AND REGISTRATION OF REFERENCE AND MEASURED SPECTRAL LINES
The proposed experiment is aimed at measuring the x-ray spectral-line wavelengths emitted by various K ions. For such measurements, one must create the investigated multicharged ions in excited states and then register their emission via a calibrated spectrometer. The feasibility of generating the required multicharged ions is determined by the parameters of the lasers used, in particular their energy and intensity, and the required high-precision measurements can be made by using a focusing spectrometer with spatial resolution (FSSR)
As mentioned above, precise wavelength measurements require the spectrometer dispersion curve to be known exactly. Generally speaking, it can be obtained analytically by using geometrical optics, but such calculations involve a cumbersome procedure to obtain various parameters associated with the relative positions of the spectral source (the plasma), dispersive crystal, and detector. Even if the dispersion curve is derived exactly for the ideal experimental geometry, unavoidable uncertainties associated with the spectrometer alignment introduce substantial errors. Based on much research experience, the absolute accuracy of the wavelength measurements cannot better several tens of milliångstroms unless additional spectral references (distinct lines with well-known wavelengths) are used.
The error can be reduced significantly (down to several milliångstroms) by combining the calculated dispersion curve with a reference line, thereby avoiding one of the main sources of measurement error, namely determining inaccurately the absolute spectral-line positions on the detector. A further improvement in measurement accuracy (reaching several tenths of a milliångstrom) results from using at least three reference lines, this being because, for the chosen spectrometer observation range, the dispersion curve can be fitted very precisely (with error less than 0.1 mÅ) with a parabolic function whose coefficients are determined easily from three reference lines. In that case, the accuracy of the wavelength measurement is independent of FSSR parameters such as the dispersive-crystal interplanar spacing and geometry (degree of sphericity) and is affected only by the signal-to-noise ratio of the detected signal and the natural width of the crystal rocking curve,
Herein, we propose using transitions in the H-like ions Al XIII and Si XIV as reference lines. Being known accurately, they should allow us to obtain the radiation spectra of the He-like K XVIII ion, including dielectronic satellites that arise because of transitions in the Li-like K XVII ion (hereinafter referred to as Li-like satellites), with accuracy no worse than 0.6 mÅ. For that purpose, targets with a complex chemical composition were irradiated by laser pulses. The plasma kinetic calculations presented herein show that all essential lines, both investigated and reference ones, should be excited effectively in the plasma at the same electron temperature, thereby making the proposed experiment feasible. Note also that there is no blending of the measured lines and those emitted by the reference material.
A highly abundant feldspar, namely KAlSi3O8 (microcline or orthoclase
![]()
Figure 1.Radiation spectrum of KAlSi3O8 plasma in x-ray wavelength range calculated using steady-state approximation for electron temperature
The dispersive elements (spherically bent crystals) of the x-ray spectrometer that is used may reflect radiation effectively in different diffraction orders, so
A. Spectrometer with α-quartz crystal
Consider a spherically bent α-quartz crystal with Miller indices (100) (2d = 8.512 Å), radius of curvature R = 150 mm, located 626 mm from the plasma source, and aligned according to the one-dimensional
![]()
Figure 2.Spectrum of radiation emitted by KAlSi3O8 plasma in wavelength range of (a) 5.8–7.2 Å and (b) 11.6–15.1 Å calculated for conditions from
B. Spectrometer with mica crystal
Consider a spherically bent mica crystal (2d = 19.9149 Å) with radius of curvature R = 150 mm, located 440 mm from the plasma source, and aligned according to the two-dimensional
The corresponding size of the spectrum on a detector is 57 mm, and the accuracy of measuring the spectral-line positions is again limited by the detector pixel size. With an image plate, the wavelength measurement accuracy is 1.5 mÅ for first-order reflection, improving to 0.8 mÅ with a CCD camera with a pixel size of 13.5 µm, and to 0.36 mÅ with a fine-grain x-ray film. The accuracy for K spectral lines would be four times better (and approximately that with the quartz crystal) given that in the proposed scheme they undergo fourth-order reflection.
III. PREFERABLE LASER PARAMETERS
As mentioned above, the measured and reference spectra have close intensity values under steady-state conditions with temperature Te = 1000 eV, thereby facilitating high-precision measurements. Results of time-dependent plasma kinetics calculations using PrismSPECT show that the plasma ionization becomes steady after approximately 200 ps, which means that the optimal way to create the plasma is to use subnanosecond laser pulses with an on-target intensity of approximately 1016 W/cm2. Filters that block radiation in the ultraviolet and visible parts of the electromagnetic spectrum are usually used during the experiments. These filters are also not fully transparent for soft x rays, and their opacity is higher for the softer reference spectra. Therefore, a slightly lower plasma temperature (600–800 eV) may be required to adjust the intensities of the registered lines, thereby facilitating more-moderate laser intensities of between 1015 W/cm2 and 1016 W/cm2. Note that for a 100-µm laser focal spot, the laser pulse energy should be approximately 200 J.
Regarding the possibility of using lasers with shorter pulse duration for plasma generation, note that the plasma ionization would then not become steady. However, if the temporal intensity dependencies of the investigated and reference lines are quite similar, then even a non-steady-state plasma could be used for x-ray spectral measurements.
![]()
Figure 3.Temporal dependencies of intensities of spectral lines emitted by Al, Si, and K ions. The curves were obtained using a time-dependent kinetic model for a plasma with electron temperature
IV. EXPERIMENTAL IMPLEMENTATION
The feasibility of the discussed experiment was demonstrated at the PALS laser facility.
![]()
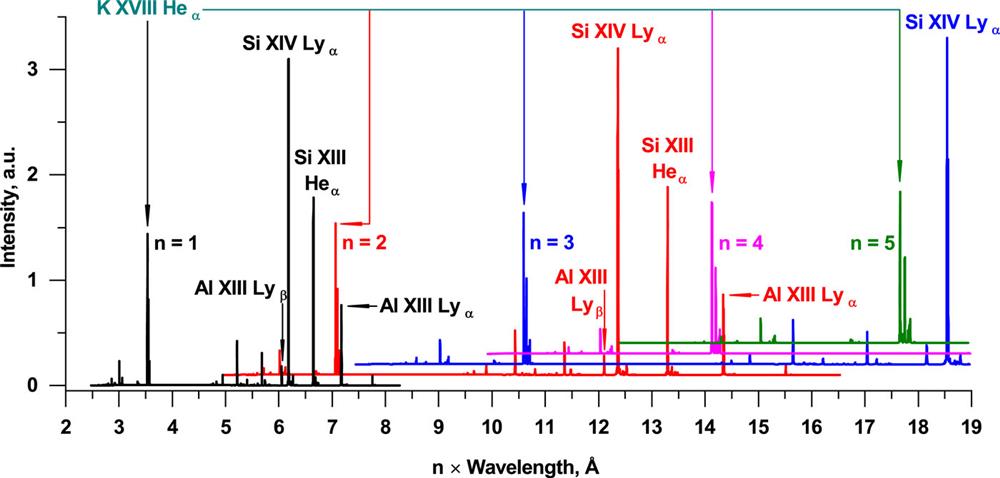
Figure 4.(a) Spectrum of x-ray radiation emitted during irradiation of orthoclase crystal by (600-J, 480-ps) laser pulse. Indicated are the most intense spectral lines corresponding to the radiative transitions in multicharged ions of Si, Al, and K (K spectral lines are observed in the second order of reflection). (b) Enlarged region with three groups of
The set of observed lines agrees exactly with
The Li-like satellites comprising three overlapping peaks correspond to different groups of transitions in Li-like K ions, which are labeled according to the notation introduced in Ref.
| Line name [transition(s)] | λ (mÅ) | Δλ (mÅ) |
|---|---|---|
| 3010.26 | 0.6 | |
| 3532.55 | 0.6 | |
| 3549.35 | 0.6 | |
| q, r ( | 3560.87 | 0.6 |
| a–d ( | 3565.06 | 0.6 |
| k, j | 3569.1 | 0.6 |
Table 1. Measured wavelengths of transitions in He- and Li-like K ions. Li-like satellites are labeled in accordance with notation introduced in Ref.
V. CONCLUSION
The wide abundance of different mineral targets of various chemical compositions opens broad possibilities for extensive application of the approach described herein. Our view is that the first targets to be investigated should be those that facilitate high-precision data for multicharged He- and Ne-like ions with fully filled inner shells. Such ions exist in a wide temperature range and have a rather simple spectral structure. The measured wavelengths of those spectral lines could then be used as references in studies of the spectral emission from other ions that have more-complicated emission features.
References
[1] S. Chaurasia, C. Kaur, A. A. Pisal et al. X-ray and ion emission studies from subnanosecond laser-irradiated SiO2 aerogel foam targets. Laser Part. Beams, 35, 505-512(2017).
[2] A. Y. Faenov, T. A. Pikuz, G. A. Vergunova et al. Ultra-bright keV X-ray source generated by relativistic femtosecond laser pulse interaction with thin foils and its possible application for HEDS investigations. Laser Part. Beams, 35, 450-457(2017).
[3] A. Bendib, C. Deutsch, H. B. Nersisyan. Diagnosing dense and magnetized plasmas irradiated by a petawatt laser. Laser Part. Beams, 34, 61-71(2016).
[4] Z. Ark, H. Flemberg. Ark. Mat. Astr. Fys, 28A, 1(1942).
[5] P. Beiersdorfer, M. Bitter, S. von Goeler et al. Experimental study of the x-ray transitions in the heliumlike isoelectronic sequence. Phys. Rev. A, 40, 150-157(1989).
[6] E. Träbert. Beam–foil spectroscopy—Quo vadis?. Phys. Scr., 78, 038103(2008).
[7] P. Beiersdorfer. A ‘brief’ history of spectroscopy on EBIT. Can. J. Phys., 86, 1-10(2008).
[8] C. Brandau, C. Kozhuharov, A. Müller et al. First dielectronic recombination measurements with H-like uranium. Radiat. Phys. Chem., 75, 1763-1766(2006).
[9] S. V. Gagarin, P. A. Loboda, I. Y. Skobelev et al. The Spectr-W3 database on the spectroscopic properties of atoms and ions. Opt. Spectrosc., 120, 507-514(2016).
[10] A. Y. Faenov, P. A. Loboda, I. Y. Skobelev et al. Spectr-W3 online database on atomic properties of multicharged ions. J. Phys.: Conf. Ser., 653, 012022(2015).
[11] X. Wei, W. Zheng, Q. Zhu et al. Laser performance upgrade for precise ICF experiment in SG-III laser facility. Matter Radiat. Extremes, 2, 243-255(2017).
[12] S. Bechet, S. Borneis, S. Weber et al. P3: An installation for high-energy density plasma physics and ultra-high intensity laser–matter interaction at ELI-beamlines. Matter Radiat. Extremes, 2, 149-176(2017).
[13] P. Audebert, C. L. Blanc, J. P. Zou et al. Recent progress on LULI high power laser facilities. J. Phys.: Conf. Ser., 112, 8-12(2008).
[14] J. D. Bonlie, J. A. Britten, B. C. Stuart et al. The titan laser at LLNL, 4-5(2006).
[15] S. Fujioka, M. Nakai, H. Shiraga et al. Fast ignition integrated experiments with Gekko and LFEX lasers. Plasma Phys. Control. Fusion., 53, 124029(2011).
[16] B. Aurand, V. Bagnoud, A. Blazevic et al. Commissioning and early experiments of the PHELIX facility. Appl. Phys. B, 100, 137-150(2010).
[17] A. Boyle, M. Galimberti, I. Musgrave et al. Review of laser diagnostics at the Vulcan laser facility. High Power Laser Sci. Eng., 3, 1-10(2015).
[18] G. I. Freidman, V. N. Ginzburg, V. V. Lozhkarev et al. Compact 0.56 Petawatt laser system based on optical parametric chirped pulse amplification in KD*P crystals. Laser Phys. Lett., 4, 421-427(2007).
[19] T. Gong, L. Hao, Z. Li et al. Recent research progress of laser plasma interactions in Shenguang laser facilities. Matter Radiat. Extremes, 4, 055202(2019).
[20] V. A. Boyko, V. G. Pal’chikov, I. Y. Skobelev et al. Spectroscopic Constants of Atoms and Ions: Spectra of Atoms with One or Two Electrons(1994).
[21] M. A. Alkhimova, A. Y. Faenov, I. Y. Skobelev et al. Accounting for the instrument function of crystal spectrometers operating in many reflection orders in the diagnostics of laser plasma from its continuum spectrum. Quantum Electron., 48, 749-754(2018).
[22] A. I. Erko, A. Y. Faenov, S. A. Pikuz et al. High-performance x-ray spectroscopic devices for plasma microsources investigations. Phys. Scr., 50, 333-338(1994).
[23] L. Alianelli, M. S. del Rio, A. Y. Faenov et al. X-ray reflectivity of curved alpha-quartz crystals. Phys. Scr., 69, 297-302(2004).
[24] V. M. Dyakin, A. Y. Faenov, I. Y. Skobelev et al. Precision measurements of the wavelengths of spectral lines of multiply charged krypton and argon ions formed in a gas target heated by laser radiation. Kvantovaya Elektron., 24, 713-714(1997).
[25] D. S. Coombs. Ferriferous orthoclase from Madagascar. Mineral. Mag. J. Mineral. Soc., 30, 409-427(1954).
[26] I. E. Golovkin, B. A. Hammel, J. J. Macfarlane, P. R. Woodruff, D. D. Meyerhofer, J. Meyer-ter-Vehn, H. Azechi et al. Simulation of the ionization dynamics of aluminum irradiated by intense short-pulse lasers. Inertial Fusion Science and Applications 2003 (IFSA 2003) State Art 2003, 457(2004).
[27] O. Renner, F. B. Rosmej. Challenges of x-ray spectroscopy in investigations of matter under extreme conditions. Matter Radiat. Extremes, 4, 024201(2019).
[28] A. L. Osterheld, D. F. Price, B. K. F. Young et al. High-resolution x-ray spectrometer based on spherically bent crystals for investigations of femtosecond laser plasmas. Rev. Sci. Instrum., 69, 4049-4053(1998).
[29] A. Cejnarova, L. Juha, K. Jungwirth et al. The Prague Asterix Laser System. Phys. Plasmas, 8, 2495-2501(2001).
[31] A. H. Gabriel. Dielectronic satellite spectra for highly-charged helium-like ion lines. Mon. Not. R. Astron. Soc., 160, 99-119(1972).


Set citation alerts for the article
Please enter your email address

© Copyright 2018-2021 | Chinese Laser Press. All Rights Reserved 沪ICP备15018463号-20