• Spectroscopy and Spectral Analysis
  • Vol. 42, Issue 4, 1209 (2022)
Ling-ling JIANG1、*, Long-xiao WANG1、1; 2;, Lin WANG2、2; *;, Si-wen GAO1、1;, and Jian-quan YUE1、1;
Author Affiliations
  • 11. College of Environment Science and Engineering, Dalian Maritime University, Dalian 116026, China
  • 22. National Marine Environmental Monitoring Center, Dalian 116023, China
  • show less
    DOI: 10.3964/j.issn.1000-0593(2022)04-1209-08 Cite this Article
    Ling-ling JIANG, Long-xiao WANG, Lin WANG, Si-wen GAO, Jian-quan YUE. Research on Remote Sensing Retrieval of Bohai Sea Transparency Based on Sentinel-3 OLCI Image[J]. Spectroscopy and Spectral Analysis, 2022, 42(4): 1209 Copy Citation Text show less
    Distribution of sampling stations
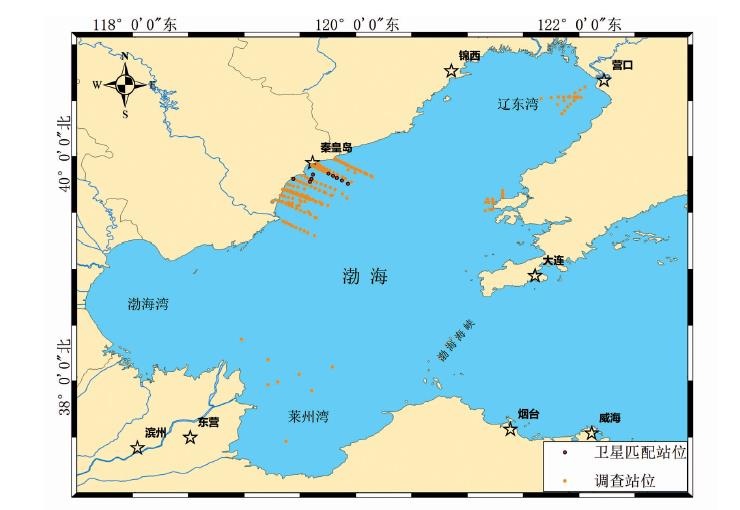
    Fig. 1. Distribution of sampling stations
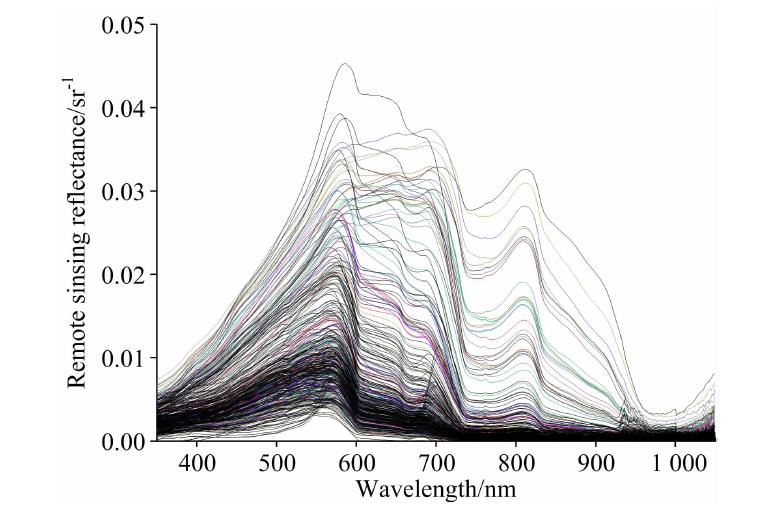
    In situ Rrs spectra
    Fig. 2. In situ Rrs spectra
    Comparison of in situ Rrs with Sentinel-3 derived OLCI Rrs
    Fig. 3. Comparison of in situ Rrs with Sentinel-3 derived OLCI Rrs
    Comparison between in situ SDD and Sentinel-3 OLCI retrieved SDD
    Fig. 4. Comparison between in situ SDD and Sentinel-3 OLCI retrieved SDD
    The spatial distribution of monthly average SDD of Bohai Sea in 2020
    Fig. 5. The spatial distribution of monthly average SDD of Bohai Sea in 2020
    The monthly change trend of Bohai Sea SDD in 2020
    Fig. 6. The monthly change trend of Bohai Sea SDD in 2020
    Band(λ/nm)rBand(λ/nm)r
    B1(400)-0.53B8(665)-0.62
    B2(412)-0.54B9(674)-0.62
    B3(442)-0.57B10(681)-0.62
    B4(490)-0.59B11(709)-0.58
    B5(510)-0.62B12(754)-0.44
    B6(560)-0.69B16(779)-0.44
    B7(620)-0.66B17(865)-0.37
    Table 1. Correlation between Rrs and SDD at central band
    Band/nmrBand/nmrBand/nmrBand/nmrBand/nmr
    400/5100.25413/5600.57443/6200.90490/6650.78560/6200.87
    400/5600.59413/6200.90443/6650.83490/6740.81560/6650.61
    400/6200.90413/6650.85443/6740.84490/6810.81560/6740.70
    400/6650.86413/6740.87443/6810.84510/6200.89560/6810.75
    400/6740.88413/6810.87490/5100.43510/6650.74
    400/6810.87413/5100.16490/5600.60510/6740.79
    413/5100.23443/5600.51490/6200.90510/6810.81
    Table 2. Correlation analysis between Rrs combination and SDD
    BandR2RMSE/sr-1MRE/%
    4000.840.000 4222.41
    4120.830.000 5424.87
    4420.820.000 7528.16
    4900.770.001 2925.02
    5100.740.001 5127.07
    5600.680.001 8821.78
    6200.900.000 5435.73
    6650.860.000 4037.97
    6740.890.000 3424.86
    6810.890.000 3221.47
    Table 3. Atmospheric correction results for each band
    模型类型模型公式MRE/%
    单波段模型lgSD=-47.80Rrs(682)+0.515 80.660.59425.37
    lgSD=-47.59Rrs(674)+0.513 60.670.58524.74
    lgSD=-47.27Rrs(665)+0.515 60.660.56423.18
    lgSD=-48.62Rrs(620)+0.588 80.680.46419.92
    lgSD=-45.75Rrs(560)+0.799 50.570.50120.54
    lgSD=-56.08Rrs(510)+0.781 10.200.75031.33
    lgSD=1 309Rrs(682)2-87.75Rrs(682)+0.629 40.710.56625.43
    lgSD=1 248Rrs(674)2-85.36Rrs(674)+0.620 20.730.54123.97
    lgSD=1 163Rrs(665)2-82.32Rrs(665)+0.614 80.740.49822.08
    lgSD=926.8Rrs(620)2-75.41Rrs(620)+0.681 60.720.40119.35
    lgSD=512Rrs(560)2-60.89Rrs(560)+0.890 60.620.50820.55
    lgSD=-1 089Rrs(510)2-28.7Rrs(510)+0.647 60.200.70827.91
    波段比值模型lgSD=0.2568Rrs(510)/Rrs(620)-0.186 30.560.51918.68
    lgSD=0.175 8Rrs(510)/Rrs(665)-0.193 70.550.83726.61
    lgSD=0.173 8Rrs(510)/Rrs(674)-0.192 10.541.12536.10
    lgSD=0.163 6Rrs(510)/Rrs(682)-0.165 40.521.12836.31
    lgSD=0.313 6Rrs(561)/Rrs(620)-0.444 50.450.66220.54
    lgSD=0.213 2Rrs(560)/Rrs(665)-0.442 30.460.63923.45
    lgSD=0.212 1Rrs(560)/Rrs(674)-0.439 80.440.90030.64
    lgSD=0.195 7Rrs(560)/Rrs(682)-0.3770.420.96332.43
    lgSD=-0.061 78Rrs(510)/Rrs(620)2+0.56Rrs(510)/Rrs(620)-0.500 30.550.65124.18
    lgSD=-0.049 37Rrs(510)/Rrs(665)2+0.532 7Rrs(510)/Rrs(665)-0.730.521.28347.86
    lgSD=-0.024 12Rrs(510)/Rrs(674)2+0.358 1Rrs(510)/Rrs(674)-0.477 60.541.42050.95
    lgSD=-0.035 93Rrs(510)/Rrs(682)2+0.438 2Rrs(510)/Rrs(682)-0.591 10.501.55158.93
    lgSD=-0.138 2Rrs(560)/Rrs(620)2+1.073Rrs(560)/Rrs(620)-1.3970.450.64026.71
    lgSD=-0.057 22Rrs(560)/Rrs(665)2+0.649 4Rrs(560)/Rrs(665)-1.1770.450.91934.01
    lgSD=-0.062 09Rrs(560)/Rrs(674)2+0.686 3Rrs(560)/Rrs(674)-1.2440.431.19645.47
    lgSD=-0.061 01Rrs(560)/Rrs(682)2+0.673 7Rrs(560)/Rrs(682)-1.2020.411.33651.66
    混合波段模型lgSD=0.083 14-33.89Rrs(620)+0.172 7Rrs(560)/Rrs(620)0.620.47816.94
    lgSD=0.2443-38.86Rrs(620)+0.142 6Rrs(510)/Rrs(620)0.670.45918.96
    lgSD=-0.010 96-19.57Rrs(560)+0.221 4Rrs(560)/Rrs(620)0.680.48315.93
    lgSD=0.212-23.29Rrs(560)+0.179 8Rrs(510)/Rrs(620)0.650.42517.73
    Table 4. Validation results of empirical transparency model
    站位号实测透明度/m反演透明度/mRMSE/mMRE/%
    13.03.020.134.50
    24.03.001.0726.86
    32.02.020.5326.42
    42.02.120.5527.73
    52.51.900.062.41
    61.82.130.6938.80
    71.21.380.9780.86
    81.81.610.5329.58
    91.81.280.1910.65
    102.21.600.135.86
    合计0.48315.93
    Table 5. The result between SDD estimated and in situ SDD
    Ling-ling JIANG, Long-xiao WANG, Lin WANG, Si-wen GAO, Jian-quan YUE. Research on Remote Sensing Retrieval of Bohai Sea Transparency Based on Sentinel-3 OLCI Image[J]. Spectroscopy and Spectral Analysis, 2022, 42(4): 1209
    Download Citation