• Laser & Optoelectronics Progress
  • Vol. 56, Issue 7, 071201 (2019)
Taotao Li1、2、*, Feng Yang2, Shigeng Li1, and Yu He1
Author Affiliations
  • 1 College of Mechanical and Electronic Engineering, Pingxiang University, Pingxiang, Jiangxi 337055, China
  • 2 State Key Laboratory of Coal Resources and Safe Mining, China University of Mining and Technology (Beijing), Beijing 100083, China
  • show less
    DOI: 10.3788/LOP56.071201 Cite this Article Set citation alerts
    Taotao Li, Feng Yang, Shigeng Li, Yu He. Extraction Method of Line-Structured Light Stripe Center Based on Gauss-Lorenz Decomposition Peak Fitting[J]. Laser & Optoelectronics Progress, 2019, 56(7): 071201 Copy Citation Text show less
    Images of line-structured light stripes. (a) Approximately ideal reflection stripe; (b) strong diffuse reflection stripe; (c) strong specular reflection stripe; (d) weak reflection stripe
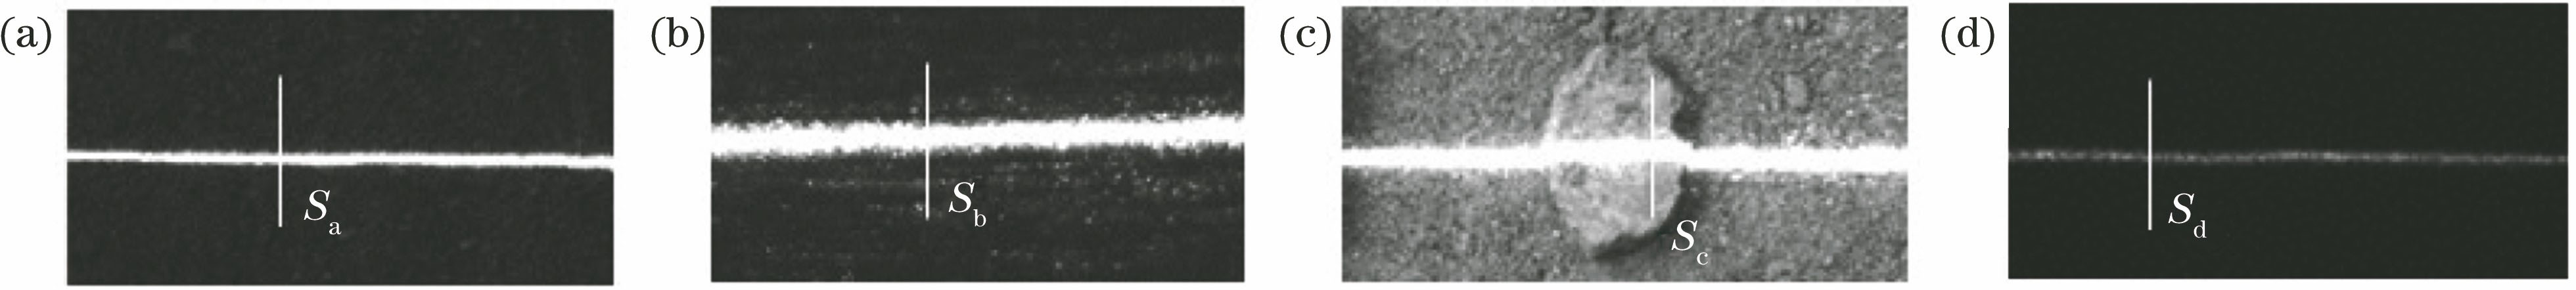
    Fig. 1. Images of line-structured light stripes. (a) Approximately ideal reflection stripe; (b) strong diffuse reflection stripe; (c) strong specular reflection stripe; (d) weak reflection stripe
    Cross-sectional gray distributions at marked positions. (a) Sa; (b) Sb; (c) Sc; (d) Sd
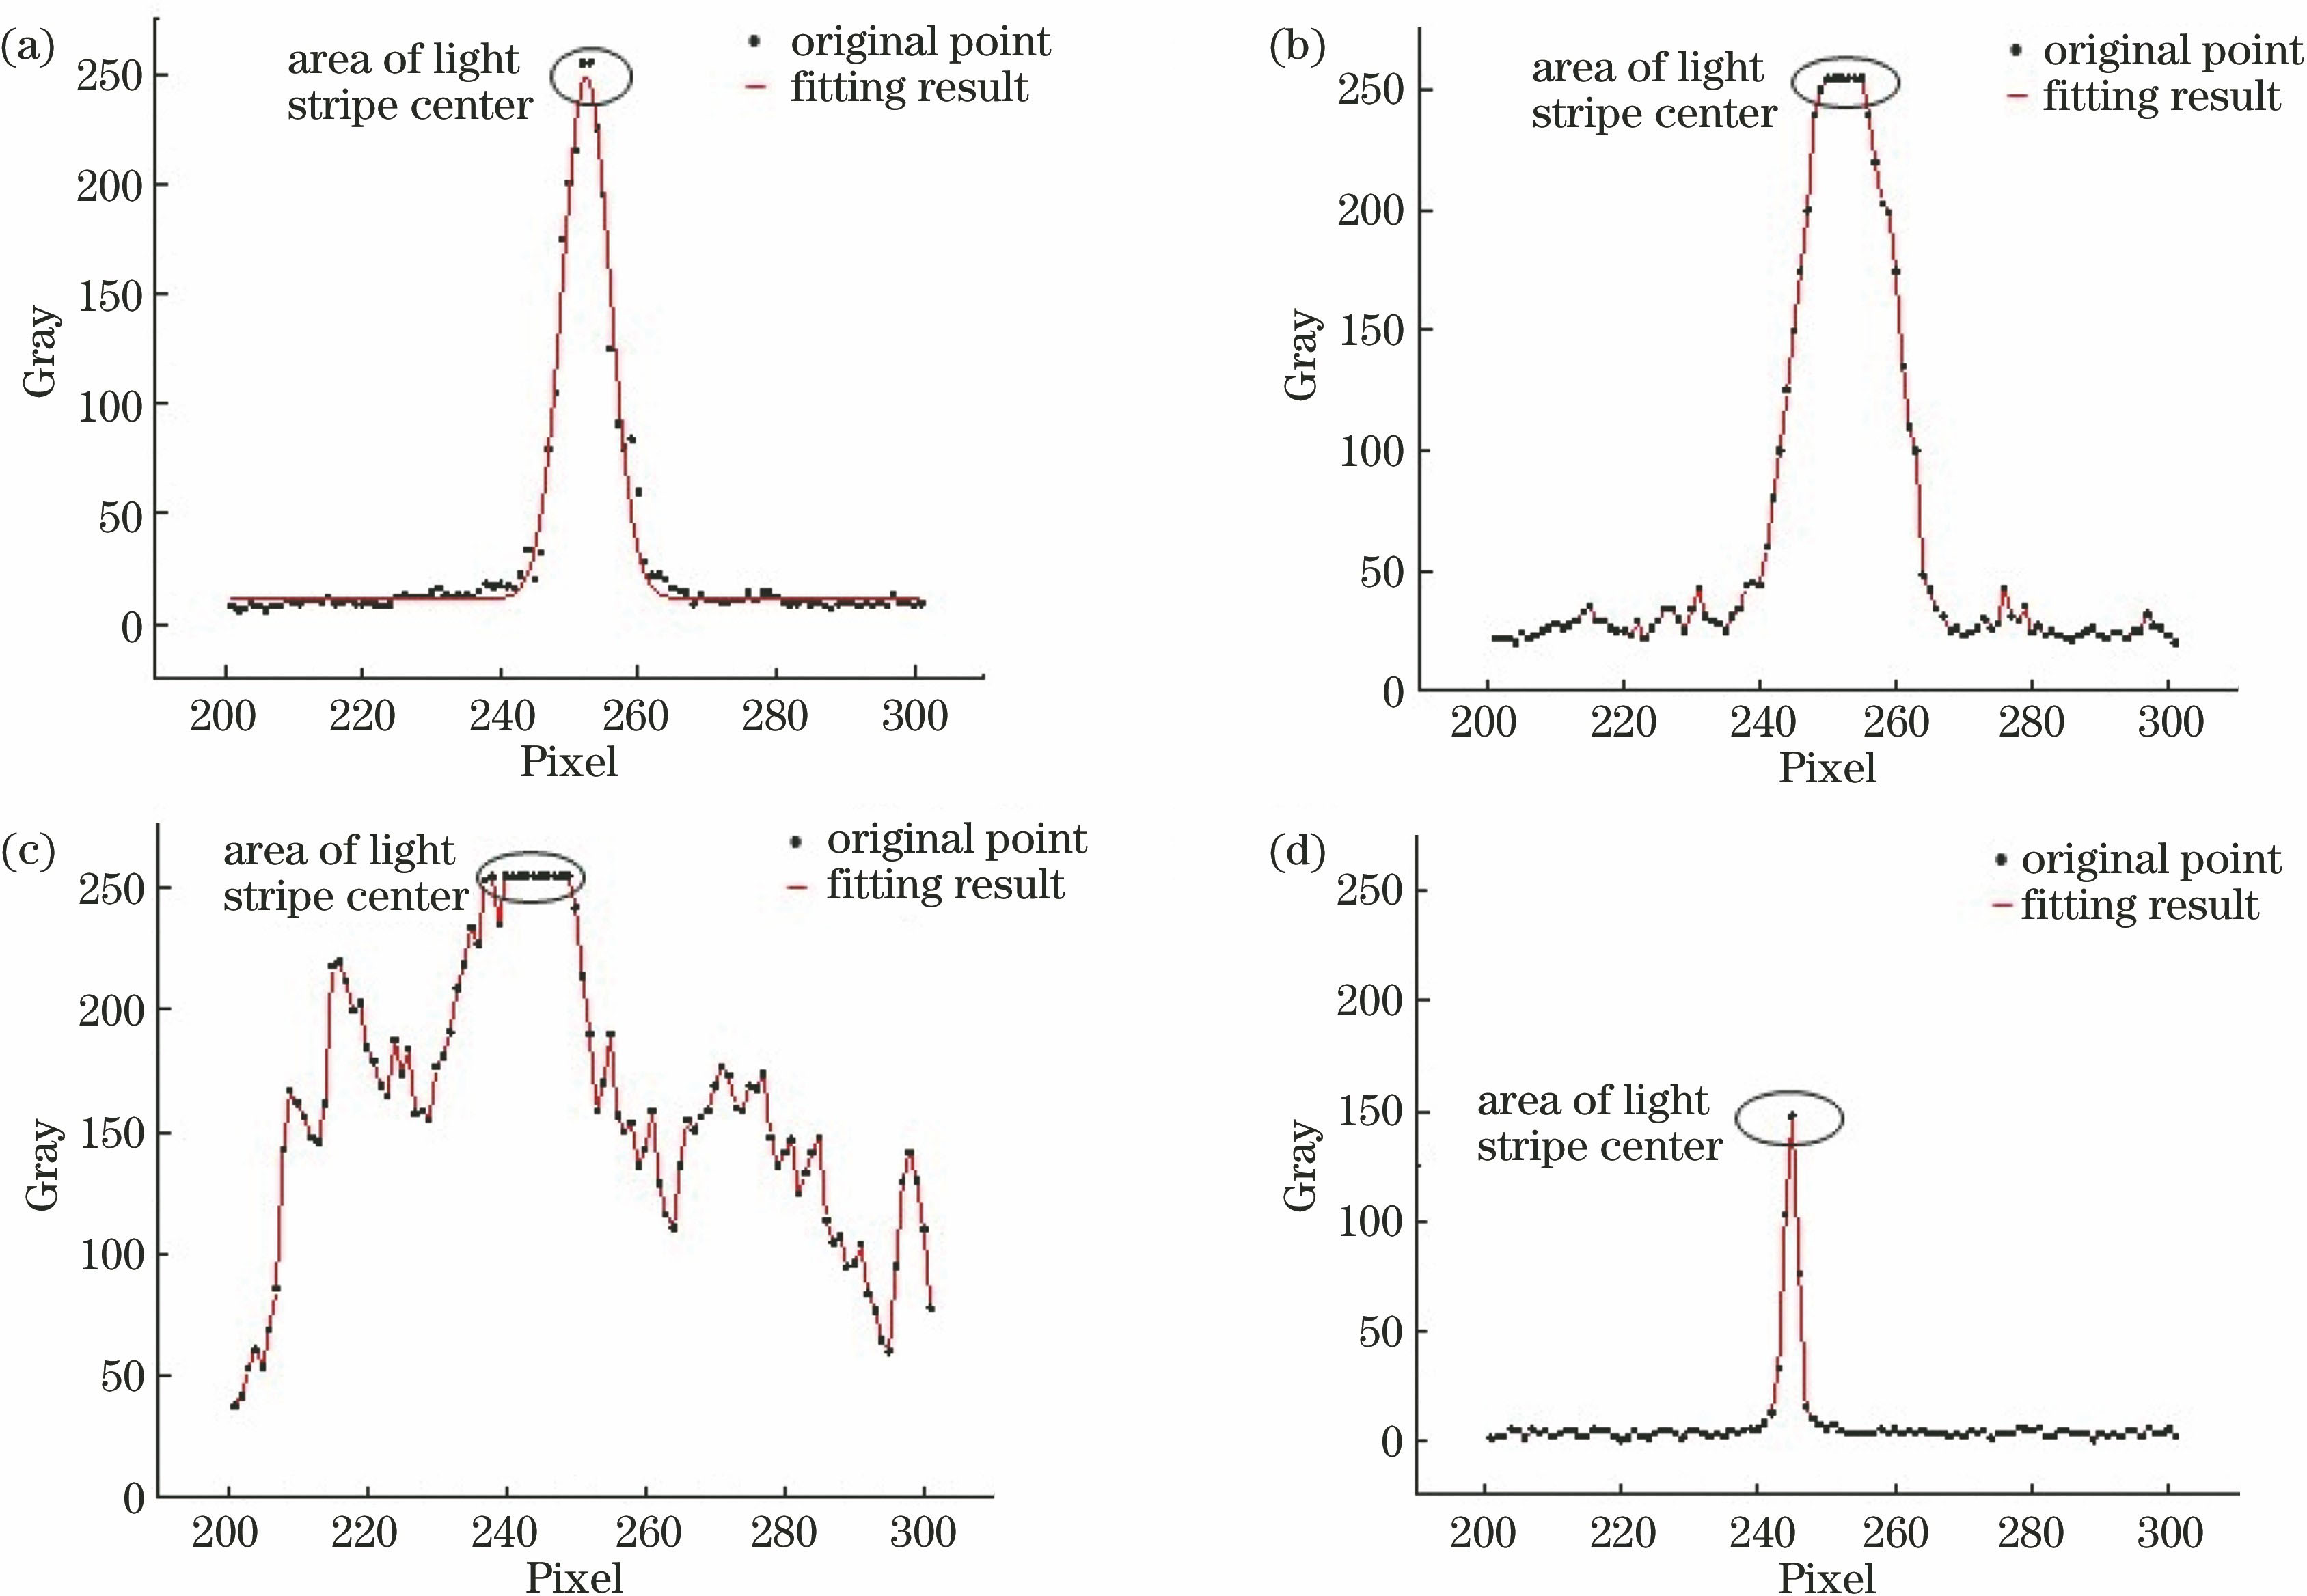
    Fig. 2. Cross-sectional gray distributions at marked positions. (a) Sa; (b) Sb; (c) Sc; (d) Sd
    Results of single Gaussian fitting. (a) Approximately ideal light stripe; (b) strong specular reflection stripe
    Fig. 3. Results of single Gaussian fitting. (a) Approximately ideal light stripe; (b) strong specular reflection stripe
    Distribution curves of Gaussian and Lorentz components
    Fig. 4. Distribution curves of Gaussian and Lorentz components
    Flow chart of light stripe center extraction process based on G-L decomposition peak fitting
    Fig. 5. Flow chart of light stripe center extraction process based on G-L decomposition peak fitting
    Normalization of weak reflection light stripe image. (a) Before normalization; (b) after normalization
    Fig. 6. Normalization of weak reflection light stripe image. (a) Before normalization; (b) after normalization
    Extraction of light stripe ROI. (a) Original image; (b) after Otsu initial extraction; (c) after removal of interference regions
    Fig. 7. Extraction of light stripe ROI. (a) Original image; (b) after Otsu initial extraction; (c) after removal of interference regions
    G-L fitting results of various types of light stripes. (a) Approximately ideal light stripe; (b) strong diffuse reflection stripe; (c) strong specular reflection stripe; (d) weak reflection stripe
    Fig. 8. G-L fitting results of various types of light stripes. (a) Approximately ideal light stripe; (b) strong diffuse reflection stripe; (c) strong specular reflection stripe; (d) weak reflection stripe
    Four types of light stripe images used in contrast experiment. (a) Approximately ideal light stripe;(b) strong diffuse reflection stripe; (c) strong specular reflection stripe; (d) weak reflection stripe
    Fig. 9. Four types of light stripe images used in contrast experiment. (a) Approximately ideal light stripe;(b) strong diffuse reflection stripe; (c) strong specular reflection stripe; (d) weak reflection stripe
    Extraction results of light stripe centers. (a) Approximately ideal light stripe; (b) strong diffuse reflection stripe; (c) strong specular reflection stripe; (d) weak reflection stripe
    Fig. 10. Extraction results of light stripe centers. (a) Approximately ideal light stripe; (b) strong diffuse reflection stripe; (c) strong specular reflection stripe; (d) weak reflection stripe
    Reliability evaluation results of light stripe centers. (a) Approximately ideal light stripe; (b) strong diffuse reflection stripe; (c) strong specular reflection stripe; (d) weak reflection stripe
    Fig. 11. Reliability evaluation results of light stripe centers. (a) Approximately ideal light stripe; (b) strong diffuse reflection stripe; (c) strong specular reflection stripe; (d) weak reflection stripe
    Time consumption comparison of extraction
    Fig. 12. Time consumption comparison of extraction
    ItemIdeal reflection stripeDiffuse reflection stripeSpecular reflection stripeWeak reflection stripe
    λλ=1λ>1λ>1λ<1
    Q(x)Q(x)≪λG0(x),Q(x)is negligibleQ(x)<λG0(x),Q(x)has effect on f(x)Q(x)<λG0(x),Q(x)has great effect on f(x)Q(x)≪λG0(x),Q(x)is negligibl
    Table 1. λ and Q(x) in energy model
    MethodAverage confidence of extracted centers Ca
    Approximately ideal light stripeStrong diffuse reflection stripeStrong specular reflection stripeWeak reflection stripe
    Method 11372.154903.023592.5189.08
    Method 21332.155041.374401192.15
    Method 31394.655550.823588.93271.15
    Method 41407.356521.384685275.13
    Table 2. Statistics of average confidence
    Taotao Li, Feng Yang, Shigeng Li, Yu He. Extraction Method of Line-Structured Light Stripe Center Based on Gauss-Lorenz Decomposition Peak Fitting[J]. Laser & Optoelectronics Progress, 2019, 56(7): 071201
    Download Citation