
Yize Li, Chenjin Deng, Wenlin Gong, Shensheng Han. Polarization Difference Ghost Imaging in Turbid Medium[J]. Acta Optica Sinica, 2021, 41(15): 1511004
- Acta Optica Sinica
- Vol. 41, Issue 15, 1511004 (2021)
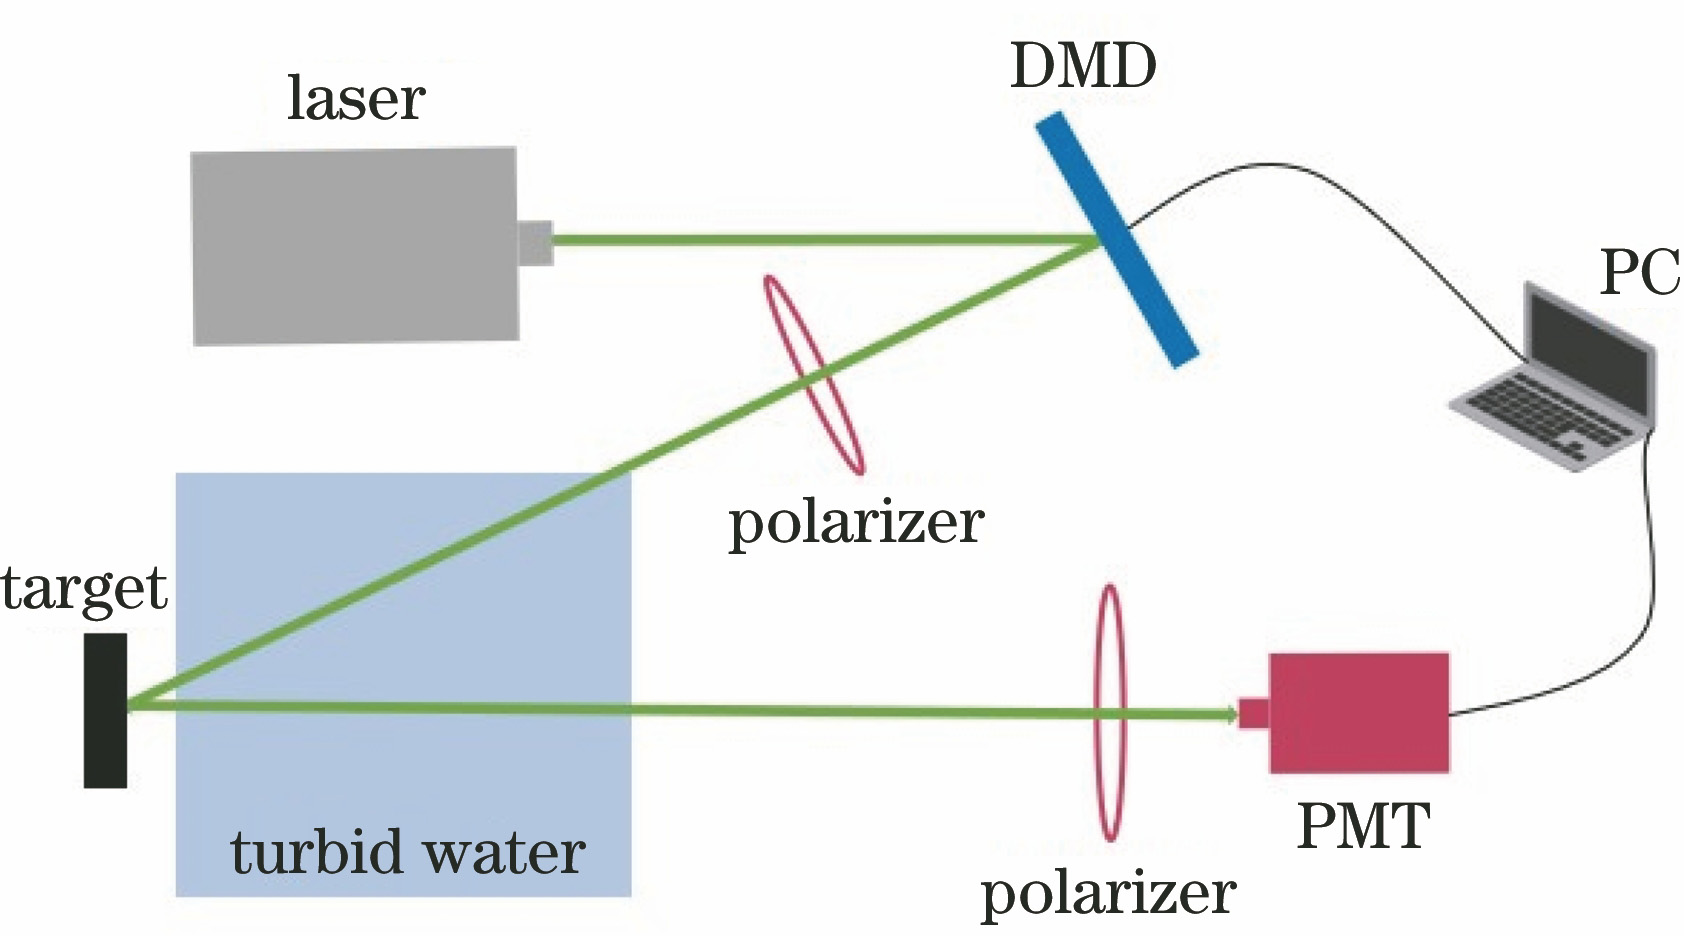
Fig. 1. Pprinciple structure of turbid media polarization GI
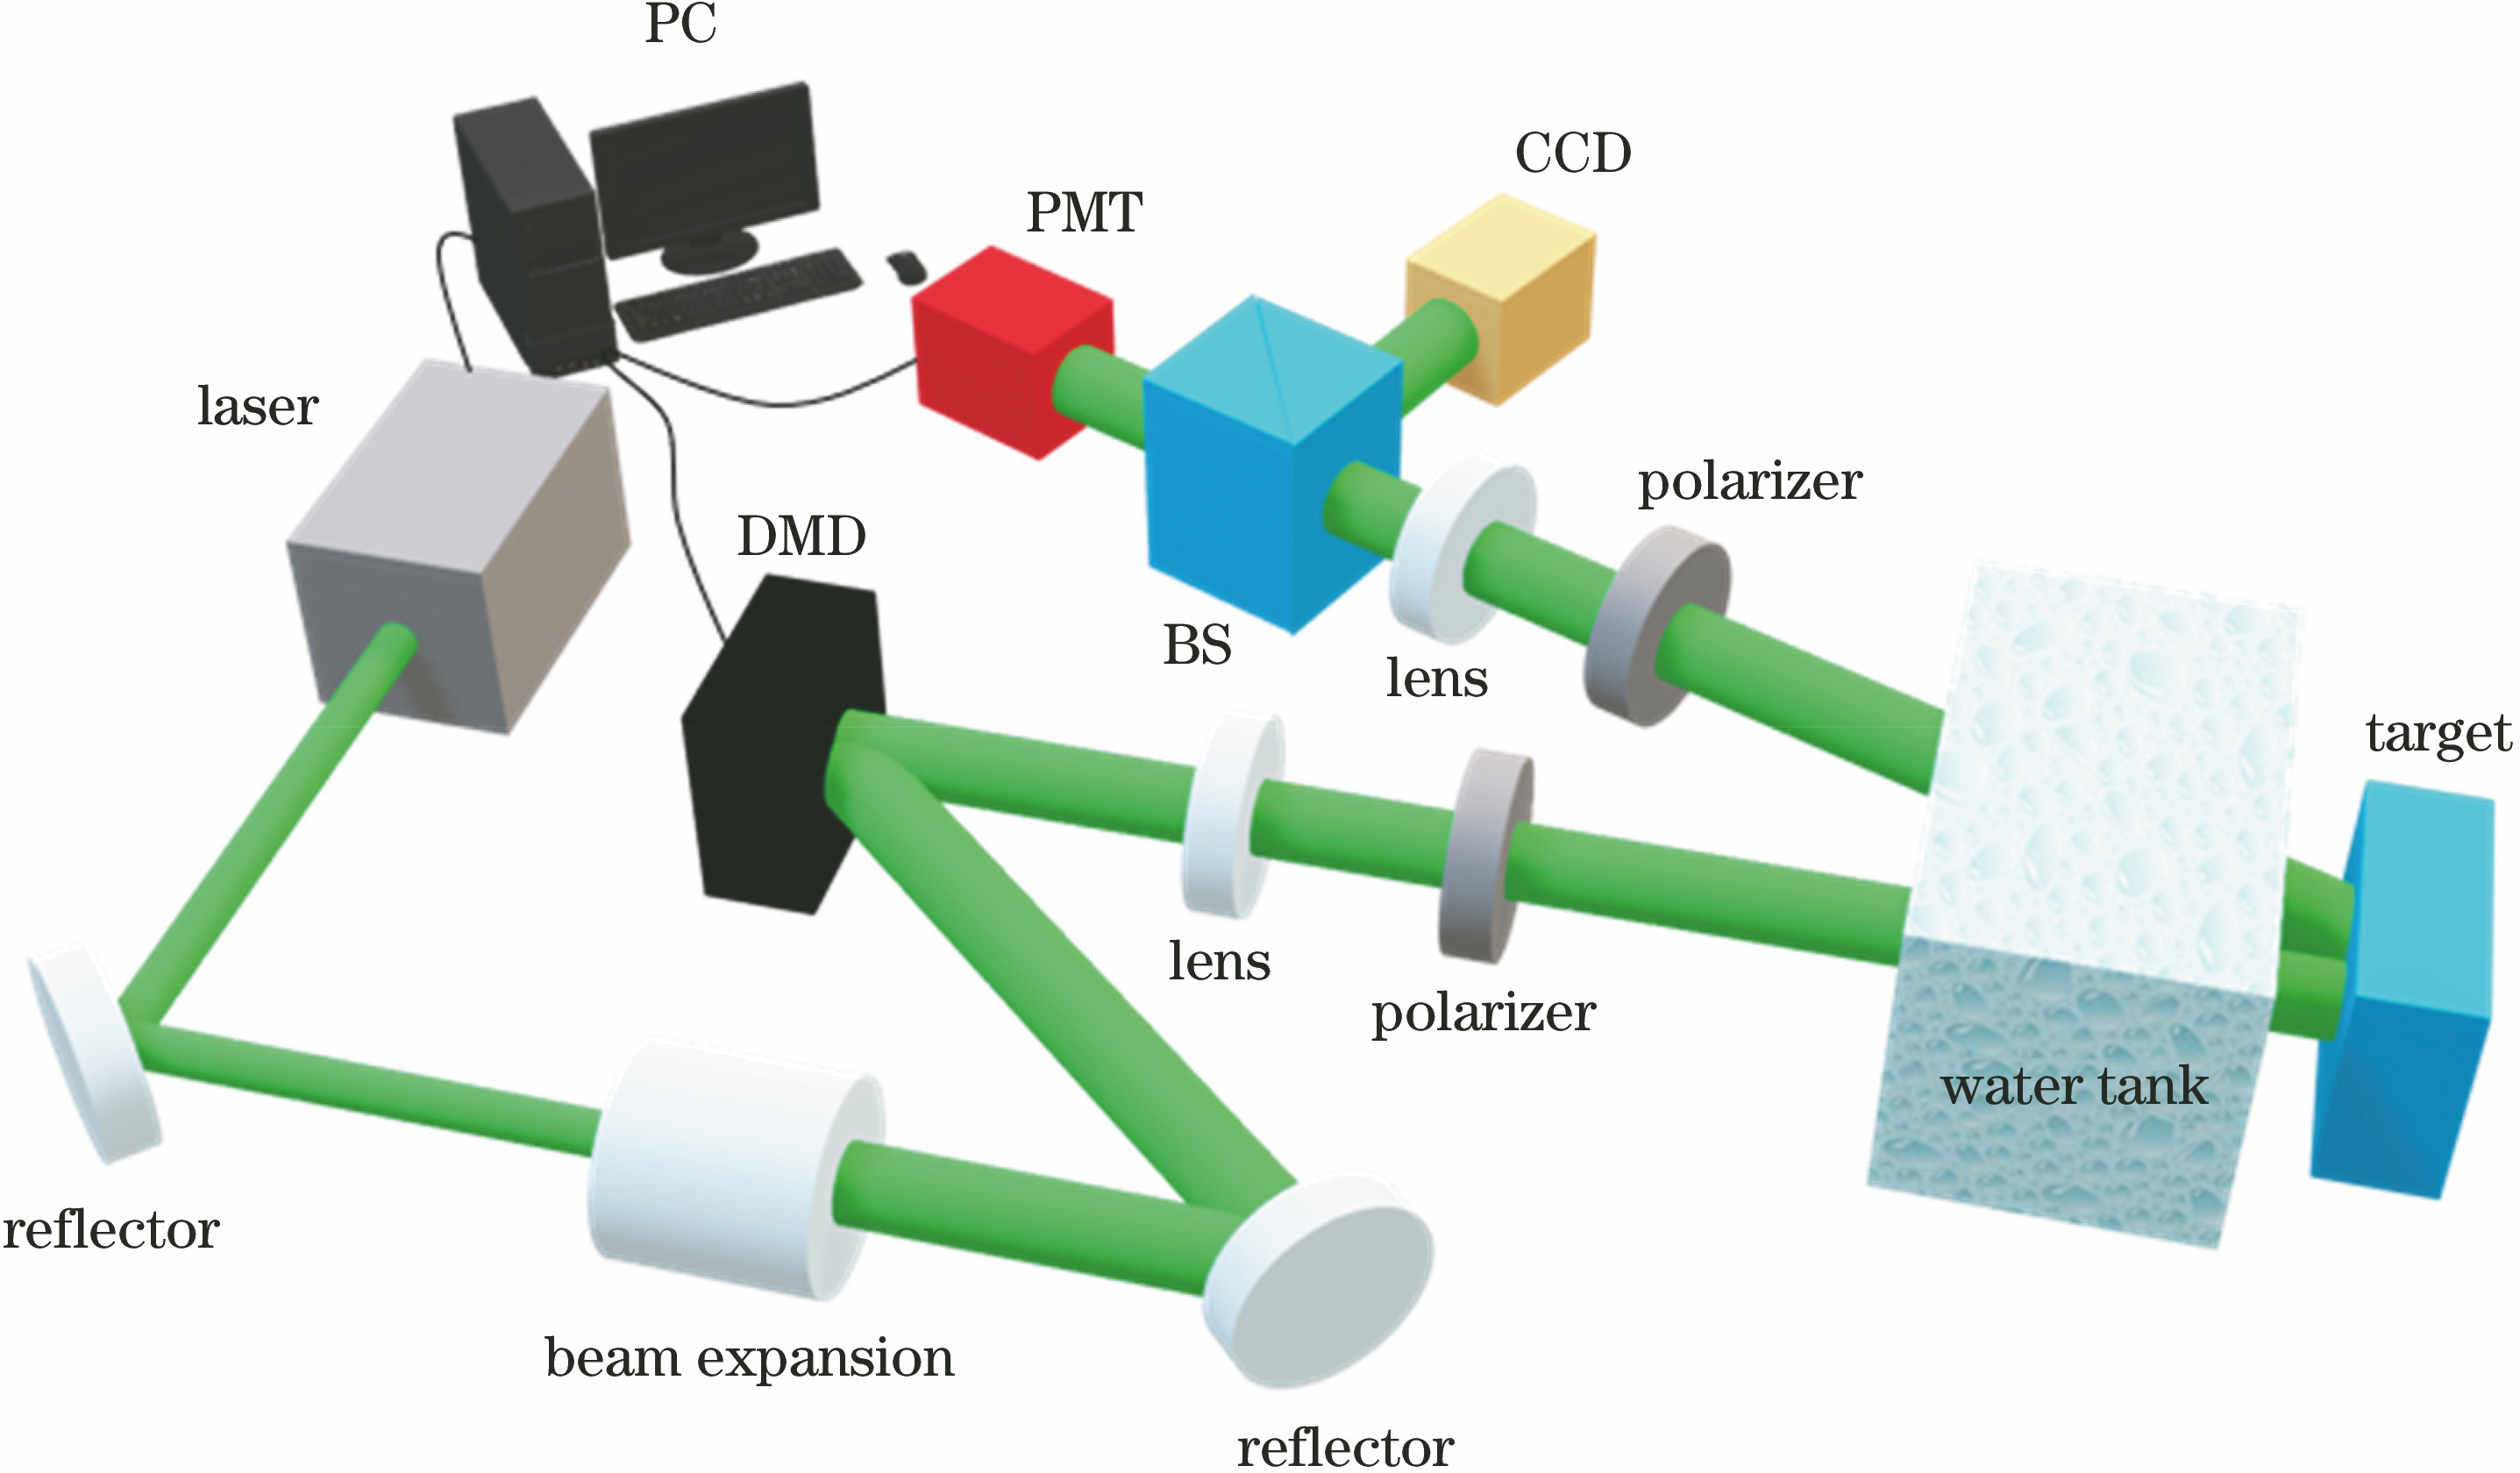
Fig. 2. Polarization ghost imaging experimental device in turbid media
Fig. 3. Experimental results. (a) Plastic target; (b) turbid media environment; (c) image taken by CCD camera when the polarizer is 0° with the amount of milk at 2.5 ml; (d) image taken by CCD camera when the polarizer is 90° with the amount of milk at 2.5 ml
Fig. 4. Experimental results at different turbidity concentrations. (a) Results of CCD camera without polarization detection; (b) results of GI without polarization detection; (c)(d) results of 0° polarization and 90° polarization GI, respectively; (e) results of polarization difference GI based on histogram preprocessing; (f) results of polarization difference GI
Fig. 5. Statistical results of gray-scale histograms of reconstructed images under different concentrations. (a)--(d) Gray-scale histogram results of adding 1.0 ml milk; (e)--(h) gray-scale histogram results of adding 1.5 ml milk; (i)--(l) gray-scale histogram results of adding 2.0 ml milk; (m)--(p) gray-scale histogram results of adding 2.5 ml milk

Set citation alerts for the article
Please enter your email address
© Copyright 2018-2021 | Chinese Laser Press. All Rights Reserved 沪ICP备15018463号-20