
Yongshuai Lu, Yuanxiang Li, Bo Liu, Hui Liu, Linli Cui. Hyperspectral Data Haze Monitoring Based on Deep Residual Network[J]. Acta Optica Sinica, 2017, 37(11): 1128001
- Acta Optica Sinica
- Vol. 37, Issue 11, 1128001 (2017)
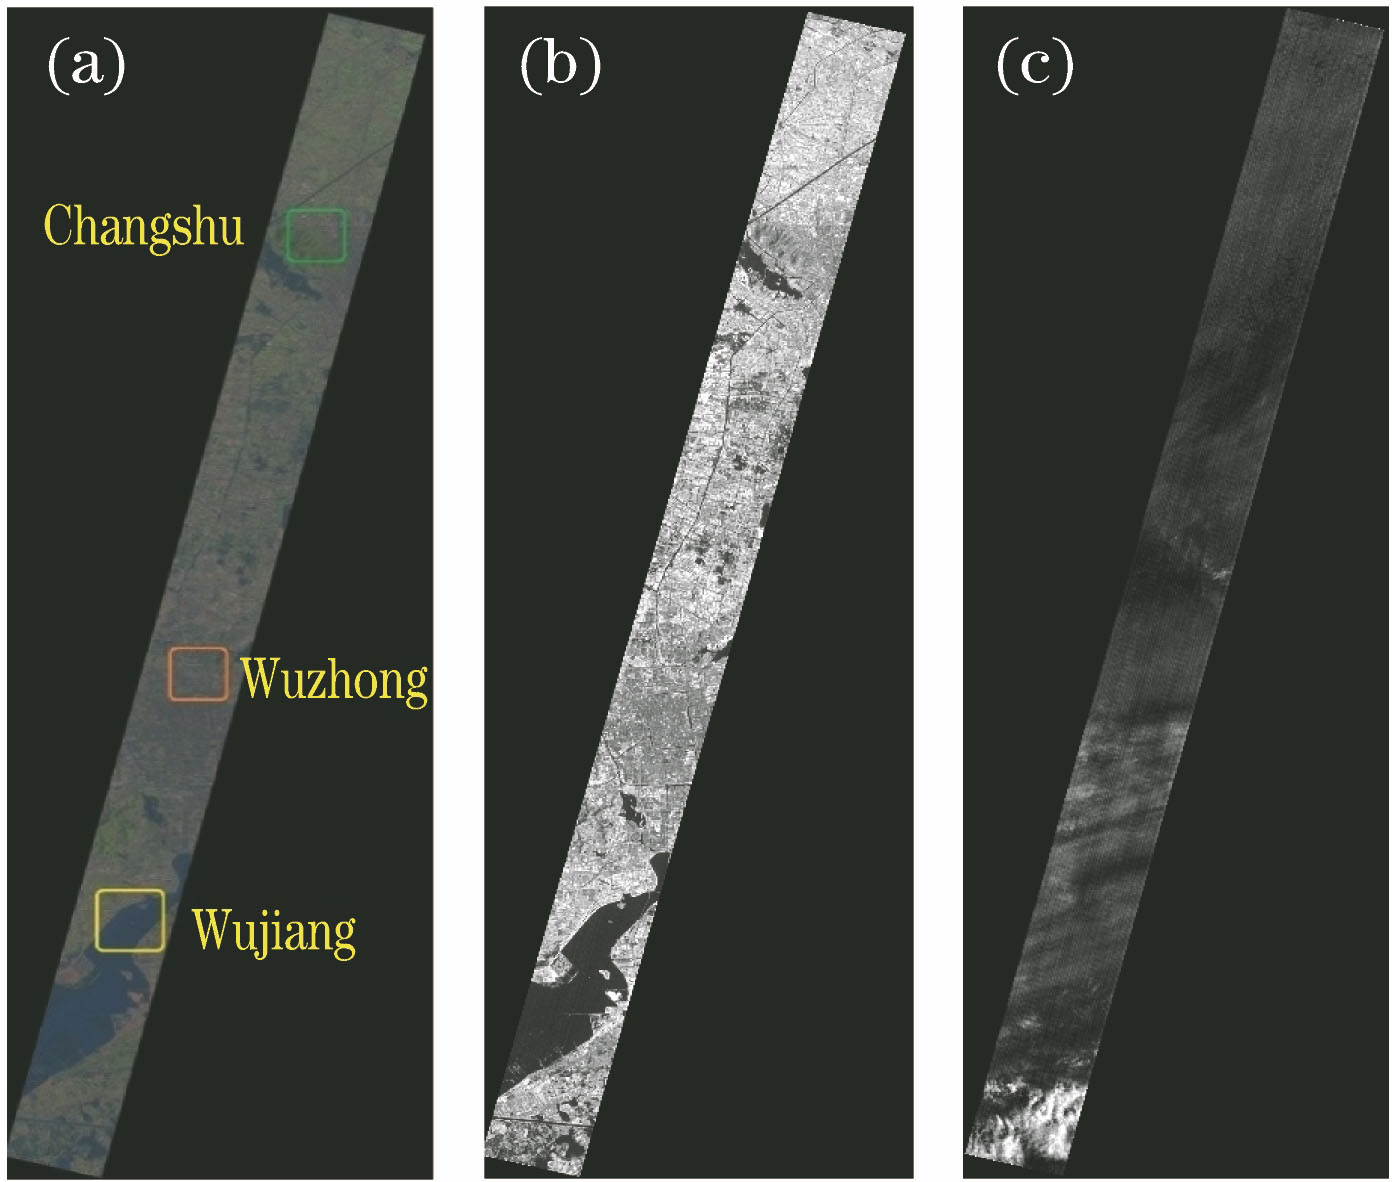
Fig. 1. Diagrams of hyperspectral data and site location of Suzhou. (a) Diagram of station location; (b) February 28, 2015, passage 150; (c) March 18, 2015, passage 179
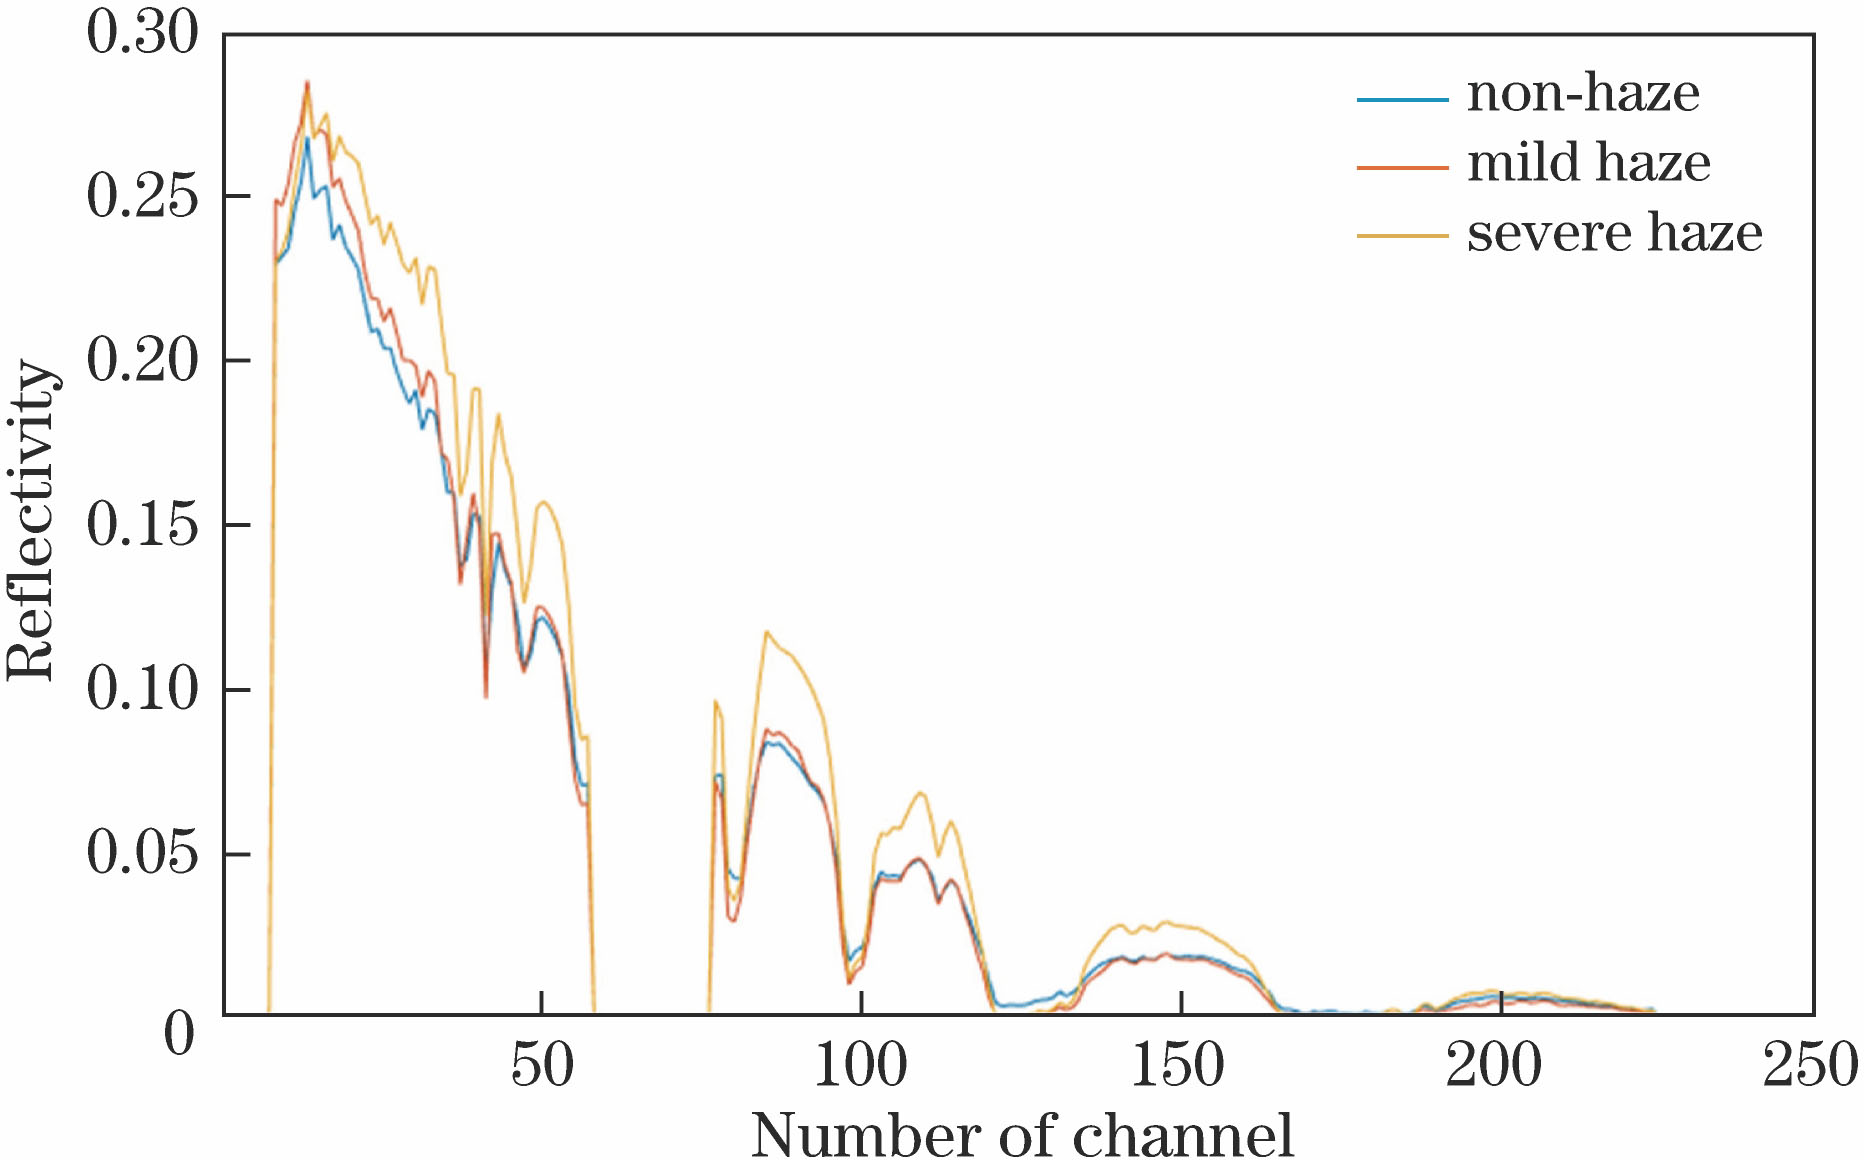
Fig. 2. Average spectral curves at underlying surface of Suzhou under different haze conditions
Fig. 3. Random sampling spectral curves of haze (red) and non-haze (blue)
Fig. 4. Scatter plots of haze (red) and non-haze (blue) with PCA characteristics
Fig. 5. Schematic of residual learning
Fig. 6. Framework of deep residual network for hyperspectral haze monitoring
Fig. 7. Schematic of internal structure of residual block
Fig. 8. Comparison of performance of CNN and ResNet with different network depths
Fig. 9. Structure analysis of DBN
Fig. 10. Comparison of network performance with large training sampling. (a) Training error; (b) test error
Fig. 11. Experiment results of large training samples of BP, CNN-13 and ResNet-13
Fig. 12. Haze monitoring results of Suzhou on January 26, 2015. (a) Diagram of site location; (b) result of SVM; (c) result of DBN; (d) result of Resnet
Fig. 13. Results of Shanghai haze monitoring on January 4, 2015. (a) Diagram of site location; (b) result of SVM; (c) result of DBN; (d) result of Resnet
| |||||||||||||||||||||||||||||||||||||||||||||||||||||||||||||||||||||||||||||||||||||||||
Table 1. Experimental results of haze recognition with different methods
| |||||||||||||||||||||||||||||||||||||||||||||||||||||||||||||||||||||||||||||||||||||||||
Table 2. Confusion matrix of haze classification

Set citation alerts for the article
Please enter your email address
© Copyright 2018-2021 | Chinese Laser Press. All Rights Reserved 沪ICP备15018463号-20