Author Affiliations
1School of Geological Engineering and Geomatics, Chang'an University, Xi'an 710054, Shaanxi, China2Xi'an Research Institute of Surveying and Mapping, Xi'an 710054, Shaanxi, Chinashow less
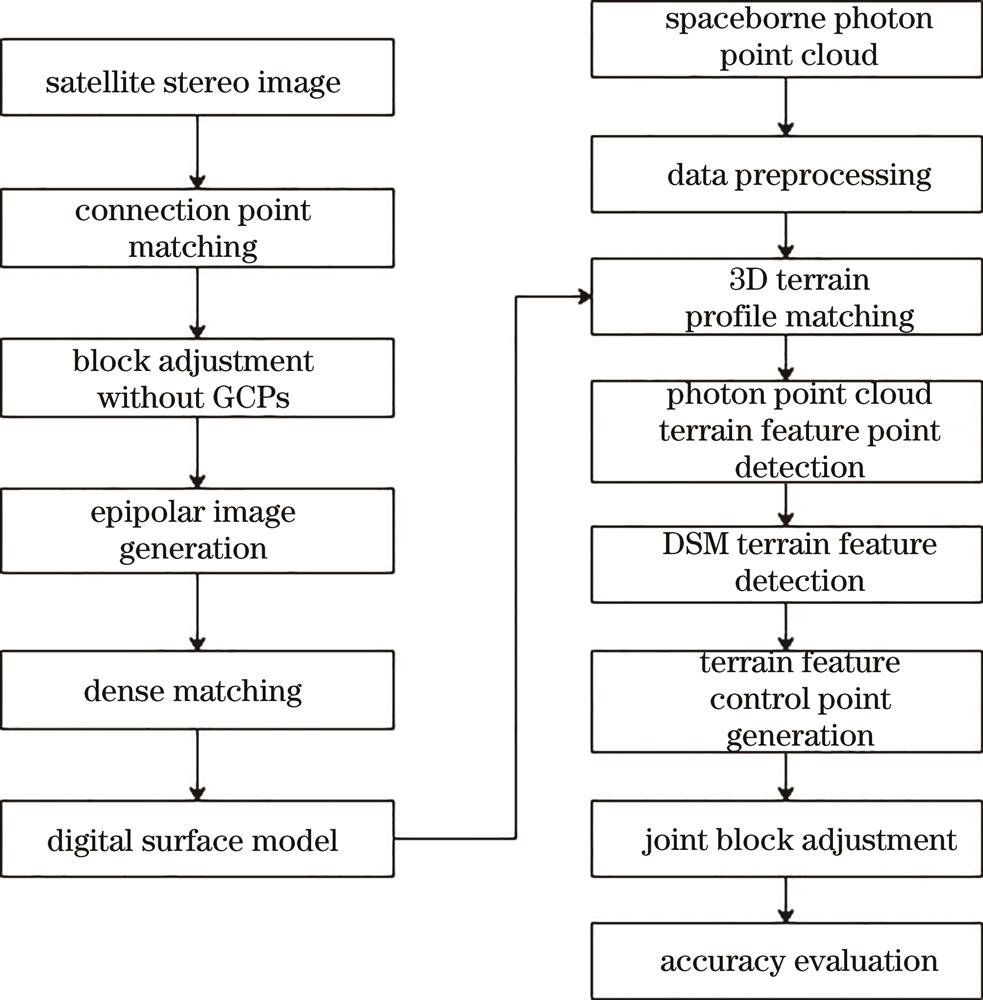
Fig. 1. Joint block adjustment process flow for spaceborne photon point cloud and stereo images
Fig. 2. Diagram of 3D terrain profile matching principle between multi-beam photon point cloud and DSM generated by stereo images
Fig. 3. Terrain feature points extracted from the photon profile point cloud
Fig. 4. Terrain features extracted from DSM generated by satellite images. (a) Valley line; (b) ridge line; (c) surface peak
Fig. 5. DSM generated by ZY-3 stereo images
Fig. 6. Comparison of photon point cloud before and after denoising. (a) Before denoising; (b) after denoising
Fig. 7. Corresponding relation of terrain features extracted from two kinds of data
Fig. 8. Distribution map of test area image, connection point, control point, check point in Xianyang
Track data name | X /m | Y /m | Z /m |
---|
ATL03_20181026073719_04230102_004_01 | 15 | 22.5 | 2.35 | ATL03_20200113222846_02780606_003_01 | 1 | 18 | 4.06 | ATL03_20200221083219_08650602_004_01 | -13.5 | 30 | 3.81 | ATL03_20201021205538_04230902_004_01 | -28.5 | 6 | 2.59 | ATL03_20210111050804_02781006_004_01 | -28.5 | -16.5 | 3.10 |
|
Table 1. 3D terrain matching results of ICESat-2 point cloud and DSM
Track data name | Mean | Standard deviation |
---|
Before matching | After matching | Before matching | After matching |
---|
ATL03_20181026073719_04230102_004_01 | 2.93 | 1.64 | 2.61 | 2.89 | ATL03_20200113222846_02780606_003_01 | 2.57 | 2.44 | 3.11 | 2.64 | ATL03_20200221083219_08650602_004_01 | 3.14 | 2.98 | 1.67 | 1.72 | ATL03_20201021205538_04230902_004_01 | 2.21 | 1.27 | 2.10 | 2.59 | ATL03_20210111050804_02781006_004_01 | 2.25 | 1.68 | 2.77 | 2.58 |
|
Table 2. Analysis results of height difference between photon point cloud data and DSM before and after matching
Slope | ME | MAE | RMSE |
---|
Before matching | After matching | Before matching | After matching | Before matching | After matching |
---|
0°-2° | 2.02 | 1.52 | 2.32 | 1.75 | 5.07 | 4.08 | 2°-6° | 3.72 | 2.79 | 4.32 | 3.29 | 8.51 | 6.47 | >6° | 2.94 | 1.65 | 3.39 | 2.72 | 15.48 | 11.28 |
|
Table 3. Elevation error statistics under different slopes before and after terrain matching
Track data | Number of points |
---|
ATL03_20181026073719_04230102_004_01 | 33 | ATL03_20200113222846_02780606_003_01 | 19 | ATL03_20200221083219_08650602_004_01 | 20 | ATL03_20201021205538_04230902_004_01 | 13 | ATL03_20210111050804_02781006_004_01 | 32 |
|
Table 4. Statistical results of terrain feature points extracted from photon point cloud data
Control condition | Mean square error of image point /pixel | Number of control points | Number of checkpoints | Plane error /m | Elevation error /m |
---|
Uncontrolled | 0.629 | | | 8.12 | 8.99 | SRTM auxiliary | 0.330 | | | 6.65 | 2.019 | 1 track photon point cloud assist | 0.328 | 10 | 5 | 2.68 | 1.450 | 0.326 | 18 | 7 | 2.64 | 1.390 | 5 track photon point cloud assist | 0.325 | 10 | 50 | 2.57 | 1.325 | 0.325 | 15 | 73 | 2.56 | 1.319 |
|
Table 5. Accuracy statistics of uncontrolled block adjustment and auxiliary block adjustment
Track name | Number of points |
---|
ATL03_20181217171333_12230106_003_01 | 13 | ATL03_20190416112928_02780306_003_01 | 44 |
|
Table 6. Statistical results of terrain feature points extracted from photon point cloud data in Xi'an
Control condition | Mean square error of image point /pixel | Number of control points | Number of checkpoints | Plane error /m | Elevation error /m |
---|
Uncontrolled | 0.675 | | | 8.17 | 9.216 | SRTM auxiliary | 0.331 | | | 6.68 | 2.321 | Photon point cloud assist | 0.327 | 10 | 16 | 2.71 | 1.526 |
|
Table 7. Accuracy statistics of uncontrolled block adjustment and auxiliary block adjustment