• Laser & Optoelectronics Progress
  • Vol. 59, Issue 13, 1314006 (2022)
Yu Ding1、2、3、4、*, Linyu Yang1、2、3、4, Jing Chen1、2、3、4, Xingyu Wang1、2、3、4, Xiaoran Guo5, Xuanchen Xu1、2、3、4, Xingqiang Zhao1、2、3、4, Yong Luo1、2、3、4, and Wenjie Chen1、2、3、4
Author Affiliations
  • 1School of Automation, Nanjing University of Information Science & Technology, Nanjing 210044, Jiangsu , China
  • 2Jiangsu Collaborative Innovation Center on Atmospheric Environment and Equipment Technology, Nanjing University of Information Science & Technology, Nanjing 210044, Jiangsu , China
  • 3Jiangsu Engineering Research Center on Meteorological Energy Using and Control, Nanjing University of Information Science & Technology, Nanjing 210044, Jiangsu , China
  • 4Jiangsu Key Laboratory of Big Data Analysis Technology, Nanjing University of Information Science & Technology, Nanjing 210044, Jiangsu , China
  • 5The No. 32181st Troop of PLA, Shijiazhuang 050000, Hebei , China
  • show less
    DOI: 10.3788/LOP202259.1314006 Cite this Article Set citation alerts
    Yu Ding, Linyu Yang, Jing Chen, Xingyu Wang, Xiaoran Guo, Xuanchen Xu, Xingqiang Zhao, Yong Luo, Wenjie Chen. Quantitative Analysis of Mg Element in Aluminium Alloy Based on Laser-Induced Breakdown Spectroscopy[J]. Laser & Optoelectronics Progress, 2022, 59(13): 1314006 Copy Citation Text show less
    Experimental setup
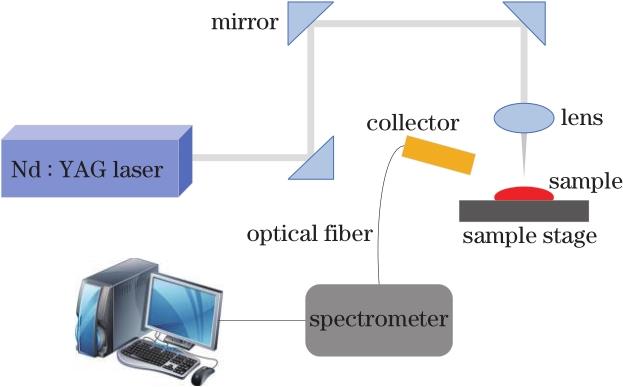
    Fig. 1. Experimental setup
    Spectra of aluminium alloy samples
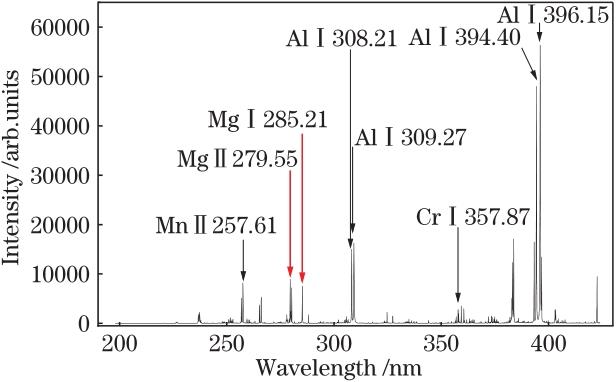
    Fig. 2. Spectra of aluminium alloy samples
    Prediction results of Mg element by PLS model
    Fig. 3. Prediction results of Mg element by PLS model
    Prediction results of Mg element by RF model
    Fig. 4. Prediction results of Mg element by RF model
    Importance distribution of full-spectrum variables
    Fig. 5. Importance distribution of full-spectrum variables
    Importance selection of RF model
    Fig. 6. Importance selection of RF model
    Prediction results of Mg element by VI-RF model
    Fig. 7. Prediction results of Mg element by VI-RF model
    Serial numberBrand of sampleMass fraction
    110600.030
    22A160.050
    3*3A210.050
    410500.050
    530020.125
    6*2A110.600
    760630.675
    860820.900
    9*60611.000
    102A121.500
    1120241.500
    12*50522.500
    1370752.500
    1457543.100
    15*50834.450
    165A055.150
    175A066.300
    Table 1. Mass fraction of Mg element in aluminum alloy samples
    ModelTest setModeling time /s
    Rp2RMSEpNumber of variables
    PLS0.68091.204240960.23
    RF0.85711.091840960.36
    VI-RF0.94610.95341350.03
    Table 2. Prediction performance of different models
    Yu Ding, Linyu Yang, Jing Chen, Xingyu Wang, Xiaoran Guo, Xuanchen Xu, Xingqiang Zhao, Yong Luo, Wenjie Chen. Quantitative Analysis of Mg Element in Aluminium Alloy Based on Laser-Induced Breakdown Spectroscopy[J]. Laser & Optoelectronics Progress, 2022, 59(13): 1314006
    Download Citation