• Photonics Research
  • Vol. 12, Issue 1, 7 (2024)
Ze-Hao Wang1、2、†, Long-Kun Shan1、2、†, Tong-Tian Weng1、2, Tian-Long Chen3, Xiang-Dong Chen1、2、4, Zhang-Yang Wang3, Guang-Can Guo1、2、4, and Fang-Wen Sun1、2、4、*
Author Affiliations
  • 1CAS Key Laboratory of Quantum Information, University of Science and Technology of China, Hefei 230026, China
  • 2CAS Center for Excellence in Quantum Information and Quantum Physics, University of Science and Technology of China, Hefei 230026, China
  • 3University of Texas at Austin, Austin, Texas 78705, USA
  • 4Hefei National Laboratory, University of Science and Technology of China, Hefei 230088, China
  • show less
    DOI: 10.1364/PRJ.488310 Cite this Article Set citation alerts
    Ze-Hao Wang, Long-Kun Shan, Tong-Tian Weng, Tian-Long Chen, Xiang-Dong Chen, Zhang-Yang Wang, Guang-Can Guo, Fang-Wen Sun. Learning the imaging mechanism directly from optical microscopy observations[J]. Photonics Research, 2024, 12(1): 7 Copy Citation Text show less
    PiMAE overview. PiMAE, a physics-informed masked autoencoder, is proposed to learn the imaging mechanism of an optical microscope.
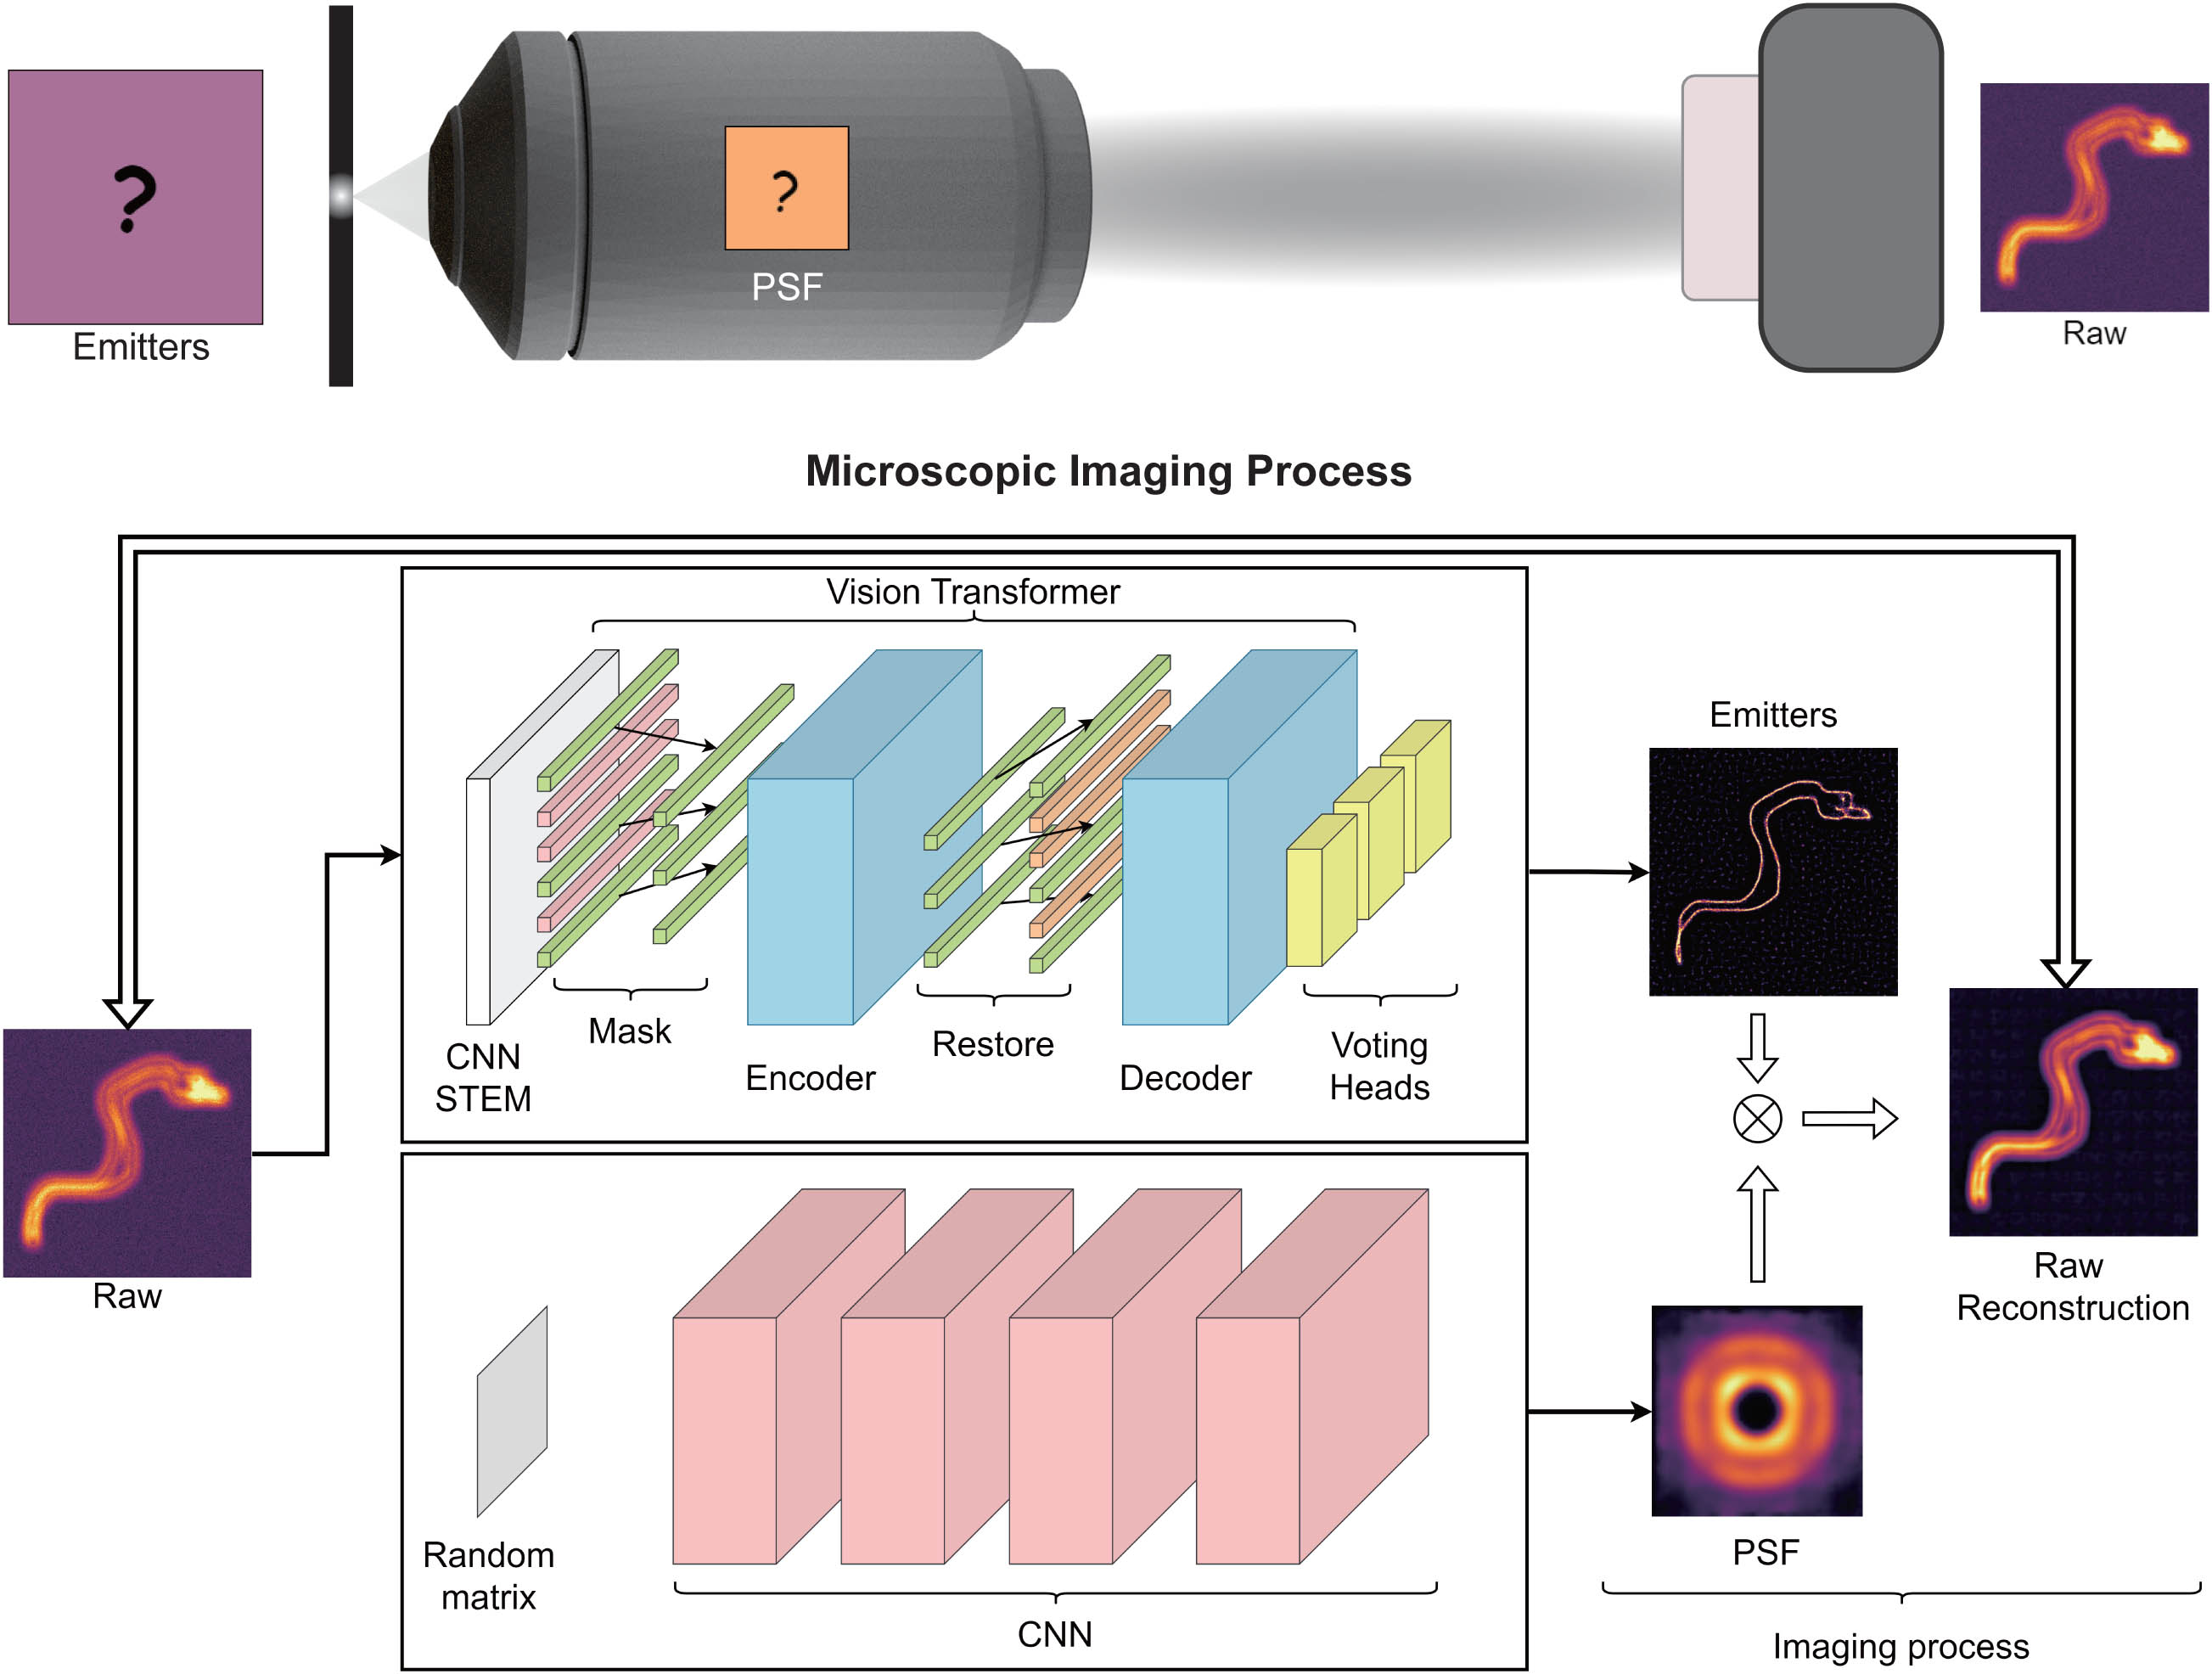
    Fig. 1. PiMAE overview. PiMAE, a physics-informed masked autoencoder, is proposed to learn the imaging mechanism of an optical microscope.
    PSF learning. The results demonstrate that PiMAE can successfully learn the PSF from raw images through the training process. (a) The figure displays the PSF of SPADE, including LG mode LG22 and HG mode HG22. The scale bar is 0.5 μm. (b) Out-of-focus (800 and 1400 nm) images under a wide-field microscope imaging setup, along with the in-focus (0 nm) image. The scale bar is 0.5 μm.
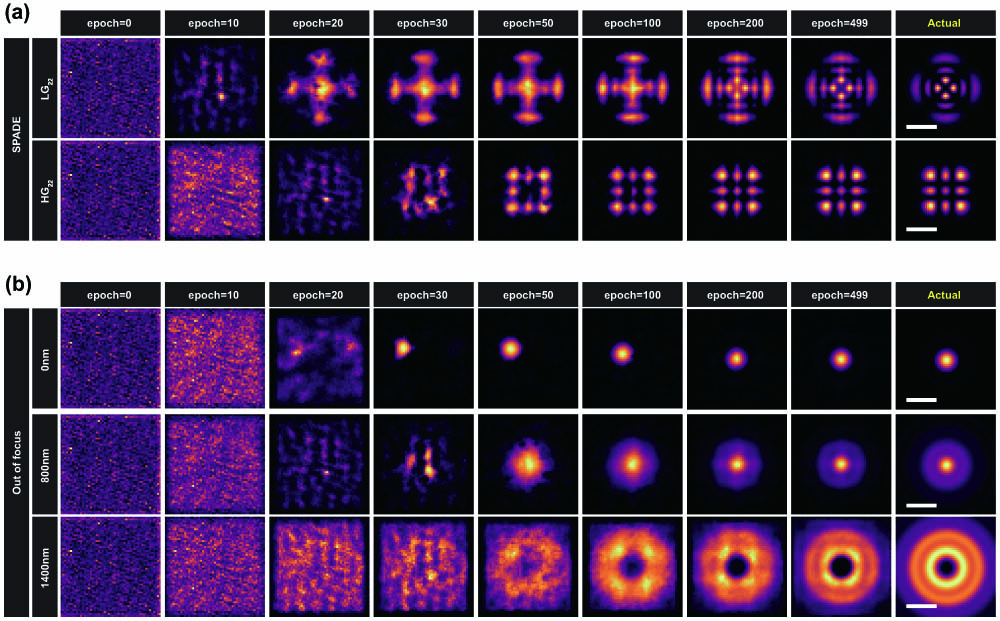
    Fig. 2. PSF learning. The results demonstrate that PiMAE can successfully learn the PSF from raw images through the training process. (a) The figure displays the PSF of SPADE, including LG mode LG22 and HG mode HG22. The scale bar is 0.5 μm. (b) Out-of-focus (800 and 1400 nm) images under a wide-field microscope imaging setup, along with the in-focus (0 nm) image. The scale bar is 0.5 μm.
    Evaluation in synthetic data sets. (a) Results of estimated PSF and emitters from out-of-focus synthetic data. The scale bar is 0.5 μm. (b) NRMSE of the results of estimated PSF from out-of-focus synthetic data; (c) NRMSE of the results of estimated emitters from out-of-focus synthetic data. (d) Results of estimated PSF and emitters from synthetic data with HG mode and LG mode (HG/LG) as PSF. The scale bar is 0.5 μm. (e) NRMSE of the results of estimated PSF from HG/LG synthetic data; (f) NRMSE of the results of estimated emitters from HG/LG synthetic data. The noise scale in the above evaluations is noisestd/rawmean=0.5.
    Fig. 3. Evaluation in synthetic data sets. (a) Results of estimated PSF and emitters from out-of-focus synthetic data. The scale bar is 0.5 μm. (b) NRMSE of the results of estimated PSF from out-of-focus synthetic data; (c) NRMSE of the results of estimated emitters from out-of-focus synthetic data. (d) Results of estimated PSF and emitters from synthetic data with HG mode and LG mode (HG/LG) as PSF. The scale bar is 0.5 μm. (e) NRMSE of the results of estimated PSF from HG/LG synthetic data; (f) NRMSE of the results of estimated emitters from HG/LG synthetic data. The noise scale in the above evaluations is noisestd/rawmean=0.5.
    Evaluation of noise robustness. (a) NRMSE of the results of estimated PSF from in-focus synthetic data; (b) NRMSE of the results of estimated emitters from in-focus synthetic data; (c) NRMSE of the results of estimated PSF from 600 nm out-of-focus synthetic data. (d) NRMSE of the results of estimated emitters from 600 nm out-of-focus synthetic data; (e) NRMSE of the results of estimated PSF from LG22 synthetic data; (f) NRMSE of the results of estimated emitters from LG22 synthetic data; the noise scale is noisestd/rawmean.
    Fig. 4. Evaluation of noise robustness. (a) NRMSE of the results of estimated PSF from in-focus synthetic data; (b) NRMSE of the results of estimated emitters from in-focus synthetic data; (c) NRMSE of the results of estimated PSF from 600 nm out-of-focus synthetic data. (d) NRMSE of the results of estimated emitters from 600 nm out-of-focus synthetic data; (e) NRMSE of the results of estimated PSF from LG22 synthetic data; (f) NRMSE of the results of estimated emitters from LG22 synthetic data; the noise scale is noisestd/rawmean.
    Superresolution imaging of ER. (a) The figures are the raw image of wide-field microscopic imaging of ER, the result of estimating the emitter from wide-field microscopic imaging using PiMAE, the result of SIM of the same field of view, and the result of wide-field microscopic imaging reconstructed by PiMAE. Data from BioSR data set [40]. The scale bar is 2.50 μm. (b) Comparison of the cross section of the PiMAE estimated emitters and SIM results; it shows that the resolution of the results obtained by PiMAE is comparable to that of SIM. (c) PiMAE estimated wide-field microscope PSF with an FWHM of 230 nm, where the diffraction limit is 229 nm.
    Fig. 5. Superresolution imaging of ER. (a) The figures are the raw image of wide-field microscopic imaging of ER, the result of estimating the emitter from wide-field microscopic imaging using PiMAE, the result of SIM of the same field of view, and the result of wide-field microscopic imaging reconstructed by PiMAE. Data from BioSR data set [40]. The scale bar is 2.50 μm. (b) Comparison of the cross section of the PiMAE estimated emitters and SIM results; it shows that the resolution of the results obtained by PiMAE is comparable to that of SIM. (c) PiMAE estimated wide-field microscope PSF with an FWHM of 230 nm, where the diffraction limit is 229 nm.
    Wide-field microscopy imaging of NV color centers. (a)–(d) Results of wide-field microscopy imaging of NV color centers at different out-of-focus distances; (a) raw images; the scale bar is 1.25 μm. (b) PiMAE estimated emitters; (c) comparison of the cross section of the raw images and the PiMAE-estimated emitters, where the black dashed line represents the raw images and the yellow solid line represents the PiMAE-estimated emitters; the peak positions of the PiMAE-estimated emitter results are constant for different out-of-focus distances, as seen from the blue dashed line. (d) PiMAE estimated PSF; FWHM of in-focus PSF is 382 nm, where the diffraction limit is 384 nm; the larger the out-of-focus distance, the larger the paraflap of the PSF, despite the decrease of the FWHM in the center region. (e) Comparison of nonstandard microscopic imaging and PiMAE estimated emitters. The scale bar is 3.2 μm. (f) Cross section of the nonstandard microscopic imaging and PiMAE estimated emitters; (g) PiMAE-estimated nonstandard microscopy PSF.
    Fig. 6. Wide-field microscopy imaging of NV color centers. (a)–(d) Results of wide-field microscopy imaging of NV color centers at different out-of-focus distances; (a) raw images; the scale bar is 1.25 μm. (b) PiMAE estimated emitters; (c) comparison of the cross section of the raw images and the PiMAE-estimated emitters, where the black dashed line represents the raw images and the yellow solid line represents the PiMAE-estimated emitters; the peak positions of the PiMAE-estimated emitter results are constant for different out-of-focus distances, as seen from the blue dashed line. (d) PiMAE estimated PSF; FWHM of in-focus PSF is 382 nm, where the diffraction limit is 384 nm; the larger the out-of-focus distance, the larger the paraflap of the PSF, despite the decrease of the FWHM in the center region. (e) Comparison of nonstandard microscopic imaging and PiMAE estimated emitters. The scale bar is 3.2 μm. (f) Cross section of the nonstandard microscopic imaging and PiMAE estimated emitters; (g) PiMAE-estimated nonstandard microscopy PSF.
    Evaluation using synthetic data based on PSF of the shape “USTC.” (a) Comparison of the raw image, the PiMAE estimated emitters, and the actual emitters; the scale bar is 0.5 μm. (b) Comparison of the actual PSF and the PiMAE-estimated PSF; the scale bar is 0.5 μm. (c) NRMSE of the estimated PSF; (d) NRMSE of the estimated emitters.
    Fig. 7. Evaluation using synthetic data based on PSF of the shape “USTC.” (a) Comparison of the raw image, the PiMAE estimated emitters, and the actual emitters; the scale bar is 0.5 μm. (b) Comparison of the actual PSF and the PiMAE-estimated PSF; the scale bar is 0.5 μm. (c) NRMSE of the estimated PSF; (d) NRMSE of the estimated emitters.
    Influence of emitter sparsity. (a) Comparison of the raw image, the PiMAE estimated emitters, and the actual emitters, and comparison of the actual PSF and the PiMAE-estimated PSF; N refers to the number of sparse lines. The scale bar is 1.0 μm. (b) NRMSE of the estimated emitters; (c) NRMSE of the estimated PSF.
    Fig. 8. Influence of emitter sparsity. (a) Comparison of the raw image, the PiMAE estimated emitters, and the actual emitters, and comparison of the actual PSF and the PiMAE-estimated PSF; N refers to the number of sparse lines. The scale bar is 1.0 μm. (b) NRMSE of the estimated emitters; (c) NRMSE of the estimated PSF.
    Network architecture. PiMAE consists of two predictors, namely, a PSF predictor and a point predictor. The point predictor outputs the location and intensity of the points.
    Fig. 9. Network architecture. PiMAE consists of two predictors, namely, a PSF predictor and a point predictor. The point predictor outputs the location and intensity of the points.
    Pretraining with COCO data set.
    Fig. 10. Pretraining with COCO data set.
    Example results on COCO. We show the masked image, MAE reconstruction, and the ground truth. The masking ratio here is 0.75.
    Fig. 11. Example results on COCO. We show the masked image, MAE reconstruction, and the ground truth. The masking ratio here is 0.75.
    Pretraining enhancements. Comparison of NRMSE metrics for emitter localization of pretrained and non-pretrained models. Using 600 nm out-of-focus data as an example, after 500 rounds of training, the learning rate is 3×10⁻⁴.
    Fig. 12. Pretraining enhancements. Comparison of NRMSE metrics for emitter localization of pretrained and non-pretrained models. Using 600 nm out-of-focus data as an example, after 500 rounds of training, the learning rate is 3×10⁴.
    Sketches data set examples.
    Fig. 13. Sketches data set examples.
    Randomly generated lines.
    Fig. 14. Randomly generated lines.
    Evaluating the effect of training set size. (a) Results of estimated PSF and emitters when the size N of the training set is 1, 5, 10, and 1000, and the size of the test set is 100; the scale bar is 1.0 μm. (b) NRMSE of the estimated emitters from synthetic data with different data set sizes; (c) NRMSE of PiMAE-estimated PSF from synthetic data with different data set sizes.
    Fig. 15. Evaluating the effect of training set size. (a) Results of estimated PSF and emitters when the size N of the training set is 1, 5, 10, and 1000, and the size of the test set is 100; the scale bar is 1.0 μm. (b) NRMSE of the estimated emitters from synthetic data with different data set sizes; (c) NRMSE of PiMAE-estimated PSF from synthetic data with different data set sizes.
    Iterative optimization in Deconvblind. The PSF estimated by Deconvblind converges to a δ function. The scale bar is 0.5 μm.
    Fig. 16. Iterative optimization in Deconvblind. The PSF estimated by Deconvblind converges to a δ function. The scale bar is 0.5 μm.
    Network architecture. (a) Original DeepSTORM architecture; (b) modified DeepSTORM architecture.
    Fig. 17. Network architecture. (a) Original DeepSTORM architecture; (b) modified DeepSTORM architecture.
    Evaluation of speckle noise robustness. (a) The estimated PSF and emitters result from synthetic data with speckle noise. The scale bar is 0.5 μm. (b) NRMSE of estimated emitters from synthetic data with speckle noise; (c) NRMSE of estimated PSF from synthetic data with speckle noise.
    Fig. 18. Evaluation of speckle noise robustness. (a) The estimated PSF and emitters result from synthetic data with speckle noise. The scale bar is 0.5 μm. (b) NRMSE of estimated emitters from synthetic data with speckle noise; (c) NRMSE of estimated PSF from synthetic data with speckle noise.
    MS-SSIM of the results of estimated emitters from out-of-focus synthetic data.
    Fig. 19. MS-SSIM of the results of estimated emitters from out-of-focus synthetic data.
    MS-SSIM of the results of estimated emitters from the SPADE Sketches data set.
    Fig. 20. MS-SSIM of the results of estimated emitters from the SPADE Sketches data set.
    Noise robustness. (a) MS-SSIM of the results of estimated emitters from the in-focus Sketches data set; (b) MS-SSIM of the results of estimated emitters from the 600 nm out-of-focus Sketches data set; (c) MS-SSIM of the results of estimated emitters from the LG22 mode Sketches data set.
    Fig. 21. Noise robustness. (a) MS-SSIM of the results of estimated emitters from the in-focus Sketches data set; (b) MS-SSIM of the results of estimated emitters from the 600 nm out-of-focus Sketches data set; (c) MS-SSIM of the results of estimated emitters from the LG22 mode Sketches data set.
    Comparison of ER imaging results. Here we show some comparative results of wide-field microscopy, SIM, and PiMAE-resolved wide-field microscopy. The length of the scale bar is 2.50 μm. Data from BioSR data set [40].
    Fig. 22. Comparison of ER imaging results. Here we show some comparative results of wide-field microscopy, SIM, and PiMAE-resolved wide-field microscopy. The length of the scale bar is 2.50 μm. Data from BioSR data set [40].
    Artifacts in superresolution images reconstructed using SIM. Reconstruction artifacts are a common issue in SIM-reconstructed images, as evidenced in (c) and (d), due to factors such as nonuniform fringe patterns or phase errors in the reconstruction process. In comparison, the PiMAE-estimated emitters do not exhibit these artifact problems. The scale bar is 1.00 μm.
    Fig. 23. Artifacts in superresolution images reconstructed using SIM. Reconstruction artifacts are a common issue in SIM-reconstructed images, as evidenced in (c) and (d), due to factors such as nonuniform fringe patterns or phase errors in the reconstruction process. In comparison, the PiMAE-estimated emitters do not exhibit these artifact problems. The scale bar is 1.00 μm.
    Wide-field microscopy imaging of NV color centers. (a) Comparison of wide-field microscopy results and PiMAE estimated emitters results at different out-of-focus distances, with invariant field of view from top to bottom, and different field of view on the left and right, respectively; the scale bar is 2.50 μm. (b) Wide-field microscopy results and PiMAE estimated emitters of nonstandard PSF when the objective is mismatched to the coverslip; the scale bar is 6.40 μm.
    Fig. 24. Wide-field microscopy imaging of NV color centers. (a) Comparison of wide-field microscopy results and PiMAE estimated emitters results at different out-of-focus distances, with invariant field of view from top to bottom, and different field of view on the left and right, respectively; the scale bar is 2.50 μm. (b) Wide-field microscopy results and PiMAE estimated emitters of nonstandard PSF when the objective is mismatched to the coverslip; the scale bar is 6.40 μm.
    Ze-Hao Wang, Long-Kun Shan, Tong-Tian Weng, Tian-Long Chen, Xiang-Dong Chen, Zhang-Yang Wang, Guang-Can Guo, Fang-Wen Sun. Learning the imaging mechanism directly from optical microscopy observations[J]. Photonics Research, 2024, 12(1): 7
    Download Citation