• Acta Optica Sinica
  • Vol. 37, Issue 9, 0912002 (2017)
Jie Miao1、2, Zhan Li2, Zijian Cui2, Dean Liu1, and Jianqiang Zhu1、*
Author Affiliations
  • 1 Key Laboratory of High Power Laser and Physics, Shanghai Institute of Optics and Fine Mechanics, Chinese Academy of Sciences, Shanghai 201800, China
  • 2 University of Chinese Academy of Sciences, Beijing 100049, China
  • show less
    DOI: 10.3788/AOS201737.0912002 Cite this Article Set citation alerts
    Jie Miao, Zhan Li, Zijian Cui, Dean Liu, Jianqiang Zhu. Dynamic Spectral Coding Fusion Imaging Detection Technique of Surface Defects[J]. Acta Optica Sinica, 2017, 37(9): 0912002 Copy Citation Text show less
    Main flow chart of dynamic spectral coding image fusion
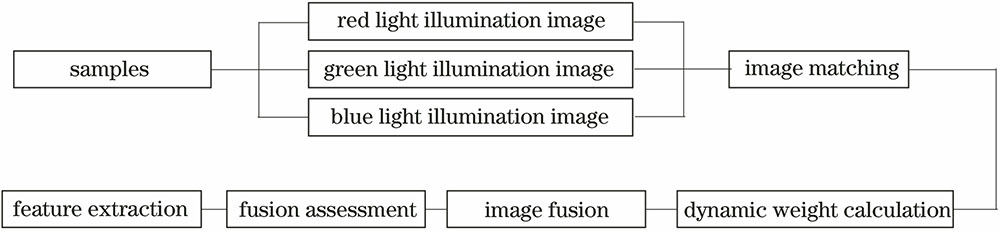
    Fig. 1. Main flow chart of dynamic spectral coding image fusion
    Noise standard deviation of weight distribution image fusion with different spectral non-linear amplification noises
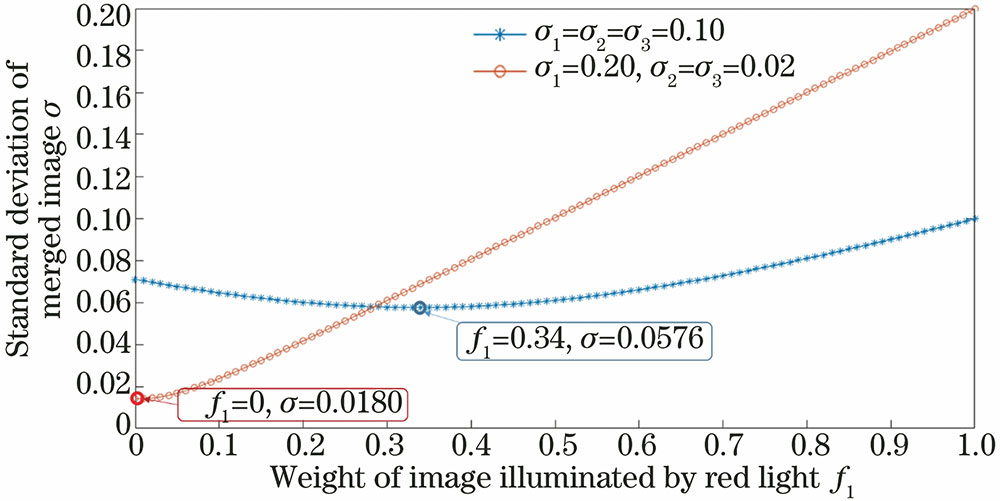
    Fig. 2. Noise standard deviation of weight distribution image fusion with different spectral non-linear amplification noises
    (a) Schematic of three-primary-color receiving arrays; (b) spectral response curves
    Fig. 3. (a) Schematic of three-primary-color receiving arrays; (b) spectral response curves
    Calibrated image of surface damage of the sample to be tested
    Fig. 4. Calibrated image of surface damage of the sample to be tested
    20× magnified surface damage images. (a) Red light; (b) green light; (c) blue light; (d) white light
    Fig. 5. 20× magnified surface damage images. (a) Red light; (b) green light; (c) blue light; (d) white light
    100× magnified images of single damage point. (a) Red light; (b) green light; (c) blue light; (d) white light
    Fig. 6. 100× magnified images of single damage point. (a) Red light; (b) green light; (c) blue light; (d) white light
    Traditional edge feature binarization images. (a) Red light; (b) green light; (c) blue light; (d) white light
    Fig. 7. Traditional edge feature binarization images. (a) Red light; (b) green light; (c) blue light; (d) white light
    Dynamic spectral coding image fusion effects. (a) Red light; (b) green light; (c) blue light; (d) average weight; (e) optimized fusion image
    Fig. 8. Dynamic spectral coding image fusion effects. (a) Red light; (b) green light; (c) blue light; (d) average weight; (e) optimized fusion image
    Comparison of surface defects imaging and image fusion. (a) Red light; (b) green light; (c) blue light; (d) optimized fusion image
    Fig. 9. Comparison of surface defects imaging and image fusion. (a) Red light; (b) green light; (c) blue light; (d) optimized fusion image
    Fusion imagef1f2f3
    Fig. 8 (a)0.700.150.15
    Fig. 8 (b)0.150.700.15
    Fig. 8 (c)0.150.150.70
    Fig. 8 (d)0.330.330.33
    Table 1. Image fusion weight distribution combinations
    Red filterGreen filterBlue filterFusion image
    VGMG1.55951.46782.13532.5365
    Number of surface defect23364553
    Table 2. Objective evaluation of the image
    Jie Miao, Zhan Li, Zijian Cui, Dean Liu, Jianqiang Zhu. Dynamic Spectral Coding Fusion Imaging Detection Technique of Surface Defects[J]. Acta Optica Sinica, 2017, 37(9): 0912002
    Download Citation