We develop a prototype endoscope system that can perform high-dynamic-range structure imaging and hyperspectral imaging. The system is used to successfully acquire the oxyhemoglobin spectrum of blood capillaries and obtain in vivo images of the various vascular pattern structures of the underside of the human tongue with high intrinsic contrast and high dynamic range. The dynamic range of the acquired high-dynamic-range mucosa image is 116.5 dB, which is 68.2 dB higher than that of the mucosa images acquired by a normal low-dynamic-range CCD. Our results demonstrate the system’s tremendous potential for the clinical diagnosis of gastrointestinal diseases.
Rapid lifestyle and environmental changes in recent times have made humans more susceptible to various gastrointestinal (GI) diseases, particularly GI cancer. The early diagnosis of cancer can significantly increase the chance of survival and aid in improving the quality of life post treatment[1]. Precancerous lesions have, in part, virtually the same vascular architecture as those of invasive carcinomas and, further, the microvascular network of tumors differs in many aspects from the normal-tissue microvascular architecture[2]. Moreover, certain important endogenous early cancer biomarkers, such as nicotinamide adenine dinucleotide plus hydrogen, flavin adenine dinucleotide, collagen, and oxyhemoglobin and deoxyhemoglobin exhibit abnormal metabolic activity and distinct reflectance-based spectral signatures pertaining to early-stage cancer development[3,4]. To detect these early cancers, it is important to precisely observe the fine structure pattern of the mucosa[5] and detect changes in the early cancer biomarkers. Therefore, a hyperspectral high-dynamic-range (HDR) multimodal endoscopic mucosa imaging technique that can provide complementary structure imaging of various mucosal vascular patterns with high dynamic range and reflectance-based hyperspectral imaging (HSI) would be highly beneficial for GI clinical diagnosis purposes.
With regard to clinical gastroenterology, biophotonics-based in vivo diagnostic tools such as optical imaging exhibit potential as an early cancer detection technology. Most cancer screening techniques rely on white-light visual examination[3]. However, these techniques result in the loss of morphological and architectural details of vascular patterns since light–tissue interactions are sensitive to intrinsic changes in absorption and scattering and, further, such interactions are wavelength-dependent[6].
The HSI technique has exhibited potential in the diagnosis of cancer in the gastrointestine[7,8]. However, existing HSI techniques have the drawback of low optical throughput, thereby resulting in low brightness of the acquired images for most spectral channels; consequently, most HSI techniques can only provide assessment of tissue pathophysiology based on the spectral characteristics of the target tissue, which limits HSI application for in vivo screening. For imaging of highly scattering tissue, the imaging system’s dynamic range plays a crucial role in the image quality[9]. Biophotonics-based optical imaging and HSI techniques only provide device-referred low-dynamic-range (LDR) images due to the intrinsic low dynamic range of normal image sensors, which results in the loss of details in bright and dark areas of the tissue image. On the other hand, HDR images can represent a greater range of luminance levels more faithfully in the real-tissue scenes, which are scene-referred and can compensate for the loss of details.
Sign up for Chinese Optics Letters TOC. Get the latest issue of Chinese Optics Letters delivered right to you!Sign up now
In this Letter, we describe a hyperspectral high-dynamic-range endoscopic mucosal imaging (HHDREMI) prototype system based on a HSI technique and, further, we propose a novel method to acquire the HDR mucosa image. The method takes advantage of the light–tissue interactions and the intrinsic spectral-sensitivity characteristics of the LDR CCD, thus providing HDR images of the mucosa, particularly the mucosal vascular patterns, with high intrinsic contrast and reflectance-based hyperspectral information of the mucosa.
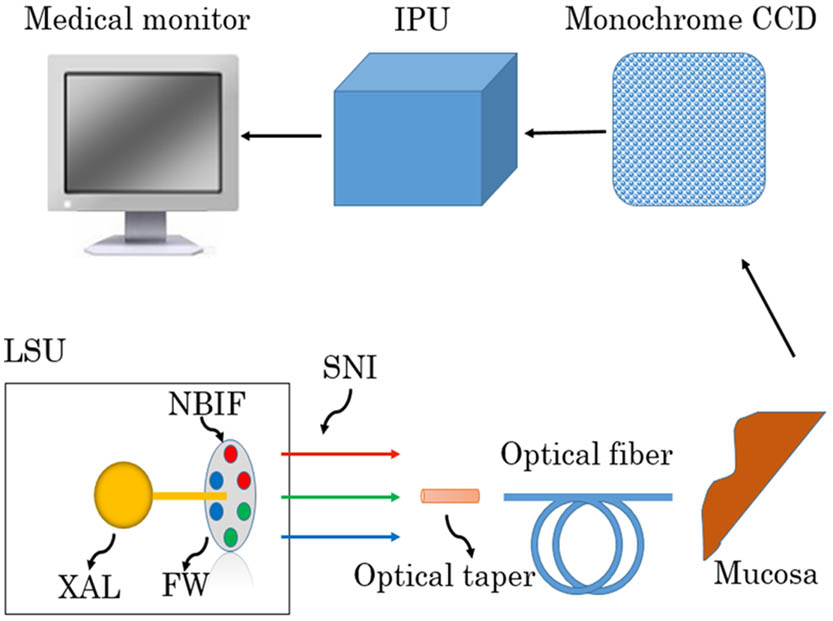
The schematic of the HHDREMI prototype system is shown in Fig. 1. The system is composed of four subsystems. The hyperspectral light source unit is based on a xenon arc lamp (PE150AF, PerkinElmer Optoelectronics), which has an integrated parabolic reflector collecting light from the light bulb and producing a collimated output beam. Twenty-four sequential narrowband bandpass interference filters centered from 400 to 630 nm at 10 nm intervals with FWHMs of 10 nm and peak transmission (Shenyang HB Optical Technology Co., LTD, China) are mounted in a motorized filter wheel positioned in the path of the collimated beam. Consequently, 24 monochromatic spectral-channel light beams are produced sequentially as the filter wheel rotates. An optical fiber bundle directs the beams to the mucosa after the optical taper focuses the light onto the bundle. A combination of lenses is attached to the distal end of the fiber bundle. The lens combination generates a 5.0 cm diameter illumination spot at a working distance of 2.0 cm. A monochrome CCD (ICX279AL, Sony) positioned at the tip of the optical fiber bundle is used to spectrally resolve the reflectance images from the mucosa. Analog signals read from the monochrome CCD are sequentially transformed into digital signals in the image processing unit. An S-video cable is used to connect the image processing unit to the medical monitor (LMD-2451MD, Sony), which is used to display the reflectance images from the mucosa.
The structure of the vascular pattern of the GI mucosa is similar to that of the human tongue[2,10], and the vascular patterns of the human tongue are categorized into three classes: the capillaries found in the superficial mucosa are designated the C1 pattern, the thicker vasculature in the deeper layers is designated as the C2 pattern, and the thick veins are designated the C3 pattern[3]. Therefore, we considered that examination of the mucosal underside of the human tongue was appropriate for our in vivo experiments. The study volunteers were instructed to gargle with normal saline to keep the oral cavity, particularly the mucosal underside of the human tongue, clean before imaging the mucosa. The volunteers were further instructed to keep their tongues curled up and still during imaging. The optical fiber bundle tip of the HHDREMI prototype system was placed at from the mucosal site.
The most popular approach for generating HDR images is to combine differently exposed LDR images of the same scene captured by a camera[11]. In our study, we proposed a novel method to acquire LDR images with the same exposure, which in turn were used to reconstruct the HDR image. The Cermax lamp spectrum is flat to a large extent except for one slight spike at 470 nm. The optical filters in our prototype endoscope system have the same FWHM and peak transmission as the spectrum. Besides, as the filter wheel rotates sequentially at a constant speed controlled by the DC motor, it can therefore be assumed that the images of the 24 spectral channels were acquired with approximately the same exposure. When the monochromatic photons of each spectral channel reach the surface of the mucosa, they interact with the mucosa. Subsequently, some photons are emitted from the mucosa after interaction. The amount of photons emitted from the mucosa differs for different wavelengths since the light–tissue interactions are wavelength dependent[6]. The monochromatic CCD detects the photons and provides the corresponding analog signal according to its spectral-sensitive characteristics. The relative response of the CCD is wavelength-dependent; the response monotonically increases for wavelengths from 400 to 550 nm, and it monotonically decreases for the wavelength range of 550 to 630 nm. The relative response exhibits a maximum of unity for the wavelength of 550 nm, and the responses are 0.60 and 0.85 for wavelengths of 400 and 630 nm, respectively. The relative response difference of the CCD contributes to the brightness variation in the various spectral-channel images.
The mucosa images of all spectral channels were acquired in 4.2 s, and these images are available online as Media 1, and are 8-bits LDR images. Neglecting the read noise of the CCD and quantization noise of the A/D convertor, the dynamic range of the 8-bit mucosa image can be calculated as , where the maximum gray level corresponds to the full-well capacity and the minimum level is typically set to 1, corresponding to the minimum signal (read noise) detected by the CCD. Each spectral-channel image in Media 1 only provides partial information on all the vascular patterns of the mucosa. From Media 1, we can clearly observe the dense capillary bed (the C1 pattern) distributed in the superficial layers of the mucosa and the thicker vasculature (C2 pattern) distributed in the deeper layers in the images corresponding to the spectral-channel range of 400 to 580 nm. However, the thick veins (C3) cannot be observed in these images. The C1 pattern gradually becomes blurred in the image corresponding to the 590 nm spectral channel and eventually disappears in 600 nm spectral-channel image. Further, the thick veins of the C3 pattern (that are distributed over the top left and top right sections of the mucosa) begin to appear in the 590 nm spectral-channel image, and their distribution can be observed in the spectral-channel images corresponding to the range of 590–630 nm. However, the C1 and C2 patterns cannot be observed at all in the spectral-channel images corresponding to the range of 590–630 nm.
Figure 2 shows the grayscale average of the mucosa images of the 24 spectral channels. The brightness variation range over the 400 nm spectral-channel mucosa image to the 630 nm spectral-channel image is comparatively large, though the images were acquired with the same exposure. The 630 nm spectral-channel image exhibits the highest grayscale average, which is 45 times that of the 400 nm spectral-channel image with the lowest grayscale average of all the mucosa images. In addition, the spectral-channel images in the range of 400–460 nm exhibit low brightness; however, the microvascular network and architecture of the C1 pattern can be observed in high detail. The spectral-channel images corresponding to the range of 590–630 nm are brighter than the other images, and they only show specific vein networks and the architecture of the C3 pattern. It is clear that the details of the vascular network and architecture in bright or dark areas of the mucosa are lost in images with lower and higher grayscale averages.
Figure 2.Gray scale average of the mucosa images of the 24 spectral channels. The insets show different levels of the gray scale average.
After acquiring the sequential LDR mucosa images that exhibit a large brightness variation range, we reconstructed the HDR mucosa images in the radiance domain by using the acquired LDR mucosa images, except the 400 nm spectral-channel image and 410 nm spectral-channel image because they are too dark to show any mucosa structure. Figure 3 illustrates the procedure of HDR image reconstruction in the radiance domain. Assume LDR images () representing the same mucosal scene are acquired at exposures () and is the mucosal scene radiance of each pixel, which is a constant. The intensity , where is the spatial index and indexes over the exposure time , and have the following relationship: where is called the camera response function (CRF). Eq. (1) can be rewritten as follows: where . To estimate the value and the different finite values that can assume, minimizing the objective function is used to solve the problem. The objective function is as follows: where is the number of pixels used for the computation, is the weighting function, and is a smoothing parameter. A robust calibration algorithm based on a polynomial mode is used to estimate the CRF of the system. To improve the robustness of the mode, a constraint is added to make the pixels with zero brightness map onto the zero mucosal radiance. A symmetric weighting function is designed to reduce the influence of the unreliable pixels, like saturated pixels. This is based on the fact that the pixel values near the center are the most reliable. The SVD method is used to minimize Eq. (3). After obtaining the function , the radiance can be acquired by Eq. (2). Despite the small imaging duration, the images exhibited tongue-motion artifacts since the volunteers could not keep their tongues entirely still. In addition, the stitching of misaligned images always causes blurry artifacts in the final HDR images. The sequence of the LDR images used for the HDR image synthesis have the feature of large variations of intensities to represent the whole dynamic range of the real mucosal scenes, which poses the difficulty in using a pixel-based method for image registration, and the feature of some saturated pixels, which offers a great challenge in using a feature-based method because some features that exist in an image may not occur in another one and, therefore, we registered the images by means of the technique of performing joint geometric and photometric registration[12] before reconstruction of the HDR mucosa image. Because there are no devices available to display the HDR image, we depict the reconstructed HDR mucosa image reproduced by tone mapping in the 16-bit format here. The algorithm of iCAM is used for tone mapping, which is based on the color appearance model and hierarchical mapping[13]. For the reconstructed HDR mucosa image, the dynamic range is . The minimum gray level is 1, but the maximum detectable gray level becomes , where and denote the maximum and minimum exposures, respectively, used in the exposure pattern[14]. In the case of the HDR image, the ratio becomes since the photoelectric transduction of the monochromatic CCD and the A/D convertor are linear. Here, denotes the maximum grayscale average of the LDR mucosa image sequence and denotes the minimum grayscale average of the images. The dynamic range of the reconstructed HDR image is . This value is 68.2 dB more than that of the 8-bit LDR mucosa images.
Figure 3.Procedure of the HDR mucosa image reconstruction in the radiance domain.
Figure 4 shows the 570 nm spectral-channel LDR mucosa image [Fig. 4(a)] and the HDR mucosa image [Fig. 4(b)], an enlargement of the 570 nm spectral-channel LDR mucosa image [Fig. 4(c)], and an enlargement of the HDR mucosa image [Fig. 4(d)]. To quantitatively evaluate the image quality, we calculated the average gradient (AG) of the LDR mucosa images and the HDR mucosa image. The AG has been chosen because it matches well with the perceived visual quality, and we used the AG to measure the clarity and layering of the image, which also reflects the contrast of the tiny details and the features of the texture transform in the image. The obtained AG values are included in the bottom right of Figs. 4(a) and 4(b). The 570 nm spectral-channel image [Fig. 4(a)] shows the maximal AG among the mucosa images of the 24 spectral channels. The AG of the HDR mucosa image is 135 times that of the 570 nm spectral-channel image. When compared with the other spectral-channel images, the HDR mucosa image is representative of a wider brightness range of the real mucosa scene and exhibits better layering. In addition, the integrated vascular network and architecture of the mucosa can be observed in the HDR mucosa image with high contrast. The microvascular branching architecture (indicated by the yellow arrow) can be clearly observed in Fig. 4(d) when compared with that in Fig. 4(c). The thick vascular branching architecture indicated by the red arrow is blurred in Fig. 4(c), while this architecture is clearly visible with high contrast in Fig. 4(d). The successive branching architecture from the large vascular component to the fine capillary network [indicated by the green arrow in Fig. 4(d)] can be clearly discerned with higher contrast than that in Fig. 4(c).
Figure 4.(a) 570 nm spectral-channel mucosa image with (c) enlargement showing the vascular network; and (b) HDR mucosa image with (d) enlargement showing the vascular network.
Besides HDR mucosa structure imaging, we used our HHDREMI prototype system to also perform reflectance-based HSI, which is an emerging imaging modality for medical applications and offers great potential for noninvasive disease diagnosis and surgical guidance in a new area of the spectrum. Figure 5 shows two spectral curves corresponding to the blood-capillary and “no-blood-capillary” regions, which are indicated by the red and purple dots, respectively, in the top left inset. The red solid line corresponds to reflectance from blood capillaries and the purple dashed line corresponds to that from regions in which there are no blood capillaries. The dominant spectral feature of the spectral curve of the blood capillary region corresponds to oxyhemoglobin absorption peaks (marked by two arrows) at 540 and 570 nm.
Figure 5.Spectral curves corresponding to blood-capillary and “no-blood-capillary” regions.
In conclusion, we propose and demonstrate a novel HDR imaging method that exploits light–tissue interactions and the intrinsic spectral-sensitive characteristics of the normal LDR CCD. The HHDREMI prototype system presented in this Letter is used to successfully perform in vivo HSI and HDR structure imaging of various vascular patterns with high endogenous contrast of the mucosal underside of the human tongue. Further increase in the spectral resolution to more precisely detect spectral information corresponding to early cancer biomarkers can be achieved by replacing the sequential optical filters with smaller-FWHM filters[15] or utilizing acousto-optic[16] or liquid crystal tunable filters[17]. Besides HSI, other modalities such as autofluorescence imaging[18,19] and photoacoustic imaging[20] can also be integrated into the prototype endoscope system. The results of our study demonstrate that the proposed prototype endoscope system can be used to more precisely diagnose GI diseases, particularly in the early detection of GI cancers.
References
[1] M. J. Horner, L. A. G. Ries, M. Krapcho, N. Neyman, R. Aminou, N. Howlader, S. F. Altekruse, E. J. Feuer, L. Huang, A. Mariotto, B. A. Miller, D. R. Lewis, M. P. Eisner, D. G. Stinchcomb, B. K. Edwards. SEER Cancer Statistics Review(2009).