
Na Chen, Yaoxiang Liu, Tiejun Wang, Zhongbin Zhu, Haiyi Sun, Xiaona Yan, Yunhua Xia, Jinhua Xia, Juan Du, Jiansheng Liu, Yuxin Leng. Harmonic generation at air–soil interface by femtosecond laser filament[J]. Chinese Optics Letters, 2017, 15(6): 061902
- Chinese Optics Letters
- Vol. 15, Issue 6, 061902 (2017)
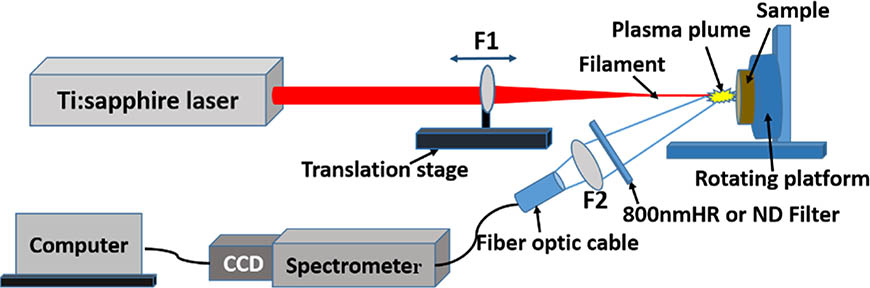
Fig. 1. Schematic diagram of the FIBS experimental set up. F1 and F2 are the focusing and collecting lenses with focal lengths of 200 and 60 mm, respectively. HR, high reflection; ND, neutral density.
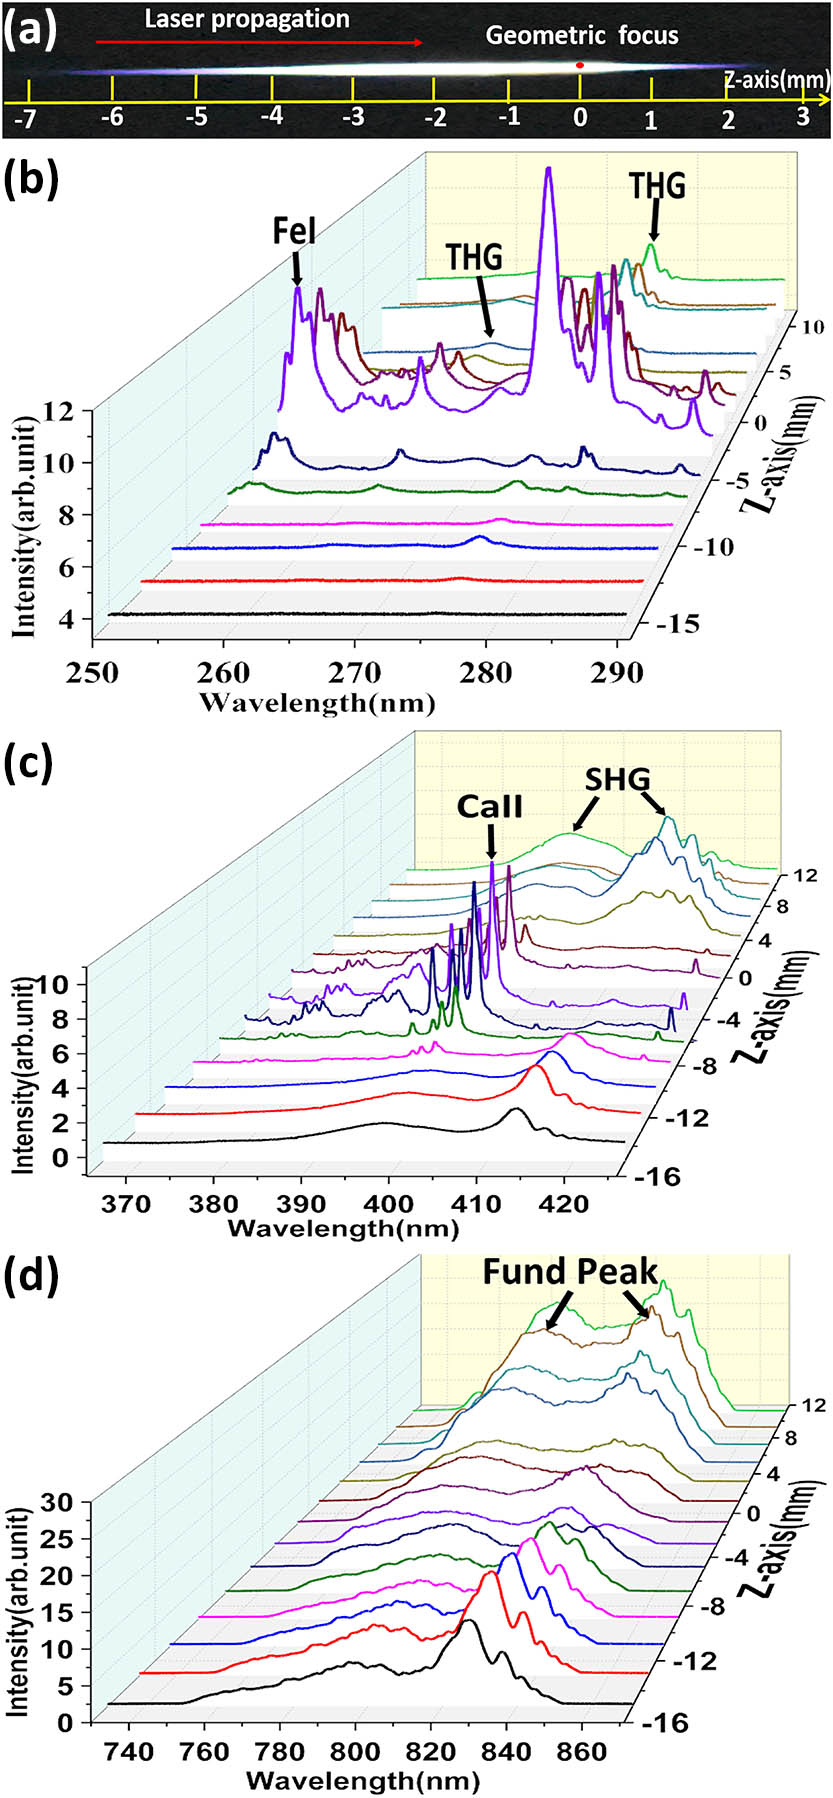
Fig. 2. (a) Image of the filament at the laser energy of 0.87 mJ, and the three-dimensional diagram of the soil FIBS spectrogram along the filament: (b) 250–290 nm, (c) 365–425 nm, (d) 730–870 nm. FeI: 252.96 nm, THG peaks around 264 and 275 nm marked in (b). CaII 396.8 nm, SHG peaks around 398 and 412 nm marked in (c). Fund peaks around 795 and 825 nm marked in (d).
Fig. 3. Peak wavelengths of THG, SHG (black), and Fund (red) as a function of the
Fig. 4. (a) Surface images of Jiuniugang soil, (b) clay loam soil, and (c) Al plate.
Fig. 5. Peak intensities of SHG and Fund as a function of the collecting angle
Fig. 6. Three-dimensional FIBS spectrum diagram of samples along the laser propagation direction (Z axis): (a) and (b) for the Al plate at the wavelength ranges of 260 to 280 nm and 390 to 407 nm, respectively; (c) and (d) for the clay loam soil sample at the wavelength ranges of 260 to 285 nm and 380 to 410 nm, respectively.
Fig. 7. Spectral peak intensities of the soil element and the harmonic waves as a function of the sample position along the laser propagation (Z axis):FeI 252.96 nm (black), THG 275 nm (red), CaII 396.8 nm (blue), and SHG 412.3 nm (magenta).

Set citation alerts for the article
Please enter your email address
© Copyright 2018-2021 | Chinese Laser Press. All Rights Reserved 沪ICP备15018463号-20