Abstract
We observe the third-harmonic generation and second-harmonic generation together with element fluorescence from the interaction of a femtosecond laser filament with a rough surface sample (sandy soil) in non-phase-matched directions. The harmonics prove to originate from the phase-matched surface harmonics and air filament, then scatter in non-phase-matched directions due to the rough surface. These harmonics occurr when the sample is in the region before and after the laser filament, where the laser intensity is not high enough to excite the element fluorescence. The observed harmonics are related to the element spectroscopy, which will benefit the understanding of the interaction of the laser filament with a solid and be helpful for the application on filament induced breakdown spectroscopy.Filament induced breakdown spectroscopy (FIBS) is a spectroscopic analysis technique combined with laser induced breakdown spectroscopy (LIBS)[1] with femtosecond laser filament technology[2] to determine the composition of a sample. Filamentation is dominated by a dynamic equilibrium between optical Kerr self-focusing and plasma defocusing due to the intense femtosecond laser pulses[3–5]. The filament can be controlled to occur at a distance as far as a few kilometers in the atmosphere. Therefore, FIBS technology has obvious advantages in remote sensing of different targets[6]. During filamentation, laser intensity is clamped[7], which could significantly improve the stability of the fluorescence signal. An ultrashort (femtosecond level) duration of laser interaction with samples will also minimize the plasma supercontinuum background, which could improve the signal-to-noise ratio[8]. FIBS has been used for sensing water vapor[9] and environment[10]. When FIBS is used for soil analysis, it has rarely been reported, although there are many publications on soil element analysis using LIBS with nanosecond laser pulses[11].
The second-harmonic generation (SHG) in an inversion symmetry medium (calcite) was first observed in 1962[12]. Bloembergen et al. proved that the SHG reflected from inversion symmetry media came from the interface in theory and experiments[13]. SHG at the silver–air interface could be enhanced by surface roughness and was highly diffused isotopically in angular distribution[14]. Third-harmonic generation (THG) is a fundamental physical process occurring at all interfaces and free from the constraint of a phase-matching condition and wavelength restriction[15]. The physical origin of surface nonlinearity is due to structural and field discontinuity[16]. In 2010, Liang et al. reported THG at interfaces induced by filaments, and applied it to studying refocusing in filaments[17]. In 2004, Sirven et al. observed the THG in the spectral signal when femtosecond laser pulses interacted with a pure aluminum (Al) plate[18]. However, the reported surface harmonics, in particular, SHG, are mainly observed in the phase-matched direction, which may limit its applications in practice.
In this work, we investigated the interaction of a femtosecond laser filament with soils and observed the THG and SHG in the non-phase-matched direction. The evolution of the surface-harmonic waves and soil element fluorescence spectrum has been systematically investigated when the sample was moved along the filament. The blue-shift of the harmonics was observed when the sample was at the position of pre-filamentation and post-filamentation. These harmonics had surface roughness dependence and are related to element fluorescence. The possible physical mechanism behind it has also been discussed.
Sign up for Chinese Optics Letters TOC. Get the latest issue of Chinese Optics Letters delivered right to you!Sign up now
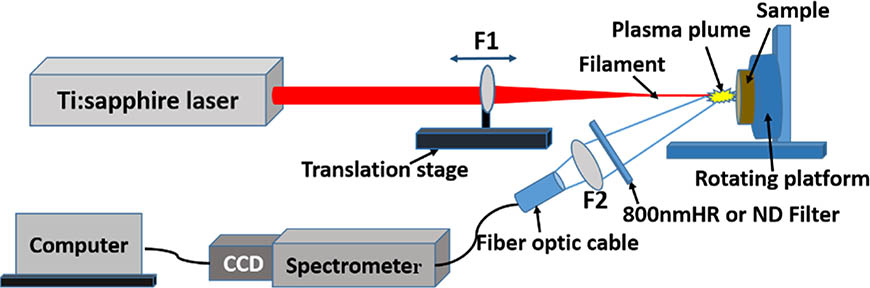
The experimental setup is depicted in Fig. 1. Experiments are conducted using a commercial Ti:sapphire laser system, which generates femtosecond laser pulses with energy up to 8 mJ, a repetition rate of 1 kHz, and a transform limited pulse duration of 30 fs at full width at half-maximum (FWHM). The laser filament was generated by focusing femtosecond laser pulses through a fused silica lens, F1, with a focal length of 200 mm. The filament interacted with the soil sample, leading to optical emission. Then, the emitted spectrum was collected by a 2 inch fused silica lens (F2) with a focal length of 60 mm at a 30° angle to the laser pulse (Fig. 1). Then, the fluorescence was coupled into an optical fiber and sent to the SR-303i-B Andor spectrometer and CCD for spectral analysis. The exposure time of the CCD was 8.24 ms, and the input slit width of the spectrometer was 100 μm. The grating used was 1200 lines/groove with a blaze wavelength at 500 nm. It was accumulated 100 times for each measurement. The spectrometer covered the wavelength range of 200–1100 nm with a resolution of 0.5 nm. An 800 nm high reflection mirror was inserted in front of lens F2 when the UV (250–430 nm) spectrum was measured. For the measurements of the spectra around 800 nm, a neutral density filter was inserted in front of lens F2 to avoid the saturation of light. The fused silica lens, F1, was mounted on a translation stage, which can move along the laser propagation direction (defined as the Z axis), so that the sample can interact with different positions of the filament. All experiments were carried out in air with a room temperature of 20°C and a relative humidity of 40%.

Figure 1.Schematic diagram of the FIBS experimental set up. F1 and F2 are the focusing and collecting lenses with focal lengths of 200 and 60 mm, respectively. HR, high reflection; ND, neutral density.
The soil samples tested were collected from the Jiuniugang district in Guixi city, Jiangxi province, China. The soil in the district is sandy loam soil. After being sieved, dried, and grinded, 80 g of soil have been put into cylindrical glassware with a diameter of 70 mm and then compressed into a 10 mm thick disk with 4 mL of purified water. Clay loam soil (GBWO7456, The National RM Resourced Network) and an Al plate were also tested for a comparison with the sandy loam soil. In the experiments, the sample was placed on the motorized rotating platform with rotational speed of 10 deg/s, which allowed for each measurement to be taken from a slightly fresh surface.
The SHG and THG were observed from the interaction of the laser filament with the Jiuniugang soil samples, as shown in Fig. 2. Figure 2(a) depicts the image of the filament taken by a Nikon D7200 digital camera. The femtosecond laser pulse energy was 0.87 mJ, and the filament length was about 9 mm (from to ). The red arrow indicates the laser propagation direction. The geometric focus (red dot) was defined as “0”. By scanning the sample at different positions of the laser filament, the emitted spectra were analyzed and shown in Figs. 2(b), 2(c) and 2(d) in different wavelength regions from 250 to 290 nm, from 365 to 425 nm, and from 730 to 870 nm, respectively.
Figure 2.(a) Image of the filament at the laser energy of 0.87 mJ, and the three-dimensional diagram of the soil FIBS spectrogram along the filament: (b) 250–290 nm, (c) 365–425 nm, (d) 730–870 nm. FeI: 252.96 nm, THG peaks around 264 and 275 nm marked in (b). CaII 396.8 nm, SHG peaks around 398 and 412 nm marked in (c). Fund peaks around 795 and 825 nm marked in (d).
The behavior of the observed spectra along the laser propagation (Z axis) has three different regions. When the sample was before the laser filament (), the emission lines of the soil elements were not generated [Figs. 2(b) and 2(c)]. But there were four peaks that appeared near 264 and 275 nm [in Fig. 2(b)], and 398 and 412 nm [Fig. 2(c)]. These peaks perfectly match with the THG and SHG of the fundamental wavelengths of 795 and 825 nm in Fig. 2(d), which proves their origins. When the soil sample was in the filament region (), the emission lines of the soil elements, for example, FeI at 252.96 nm in Fig. 2(b), CaII at 396.8 nm in Fig. 2(c), appeared. At the same time, the signal intensity at 264 and 275 nm increased. But, the SHG was barely observed. When the soil sample was after the filament (), the THG and SHG were measured. There were no element emission lines from the laser induced breakdown process. The intensity of the fundamental pulse decreased a little in the filament region, and the spectrum of the fundamental pulse was modulated after filamentation [Fig. 2(d)]. Similar results were observed when 0.4 and 0.2 mJ laser pulses were used.
Since air is an isotropy medium, its second-order nonlinear susceptibility is zero and its third-order nonlinear susceptibility is about [19]. SHG cannot be excited, and THG is difficult to be excited in air when the laser power is below the critical power for self-focusing. This was the case before and after the laser filamentation process. The laser intensity in the region is too weak to damage the surface. Surface nonlinearity at the interface of the air and soil sample leads to the generation of THG and SHG signals. Because of the rough surface of the sandy soil sample, the surface THG and SHG could be scattered and detected at a direction other than the laser propagation direction (phase-matched direction). When the sample was in the filament region, the high laser intensity can easily create high density plasmas with a high temperature. As a consequence, the emission lines of the soil elements could be excited. At the same time, the sample surface will be destroyed. Therefore, surface harmonics can hardly be generated. Note that SHG could be generated by tightly focusing a femtosecond laser pulse in air because of the gradient of photoionization induced plasma[20,21]. At certain collection angles in our experimental condition, we could not detect the SHG when the sample was removed. The forward spectrum measurement indicated that the SHG was negligibly weak. However, as the laser peak intensity during filamentation in air was clamped at about [7], phase-matched THG from the filamentation process can be obtained because of the high conversion efficiency (about )[22]. Therefore, the enhanced THG may come from the air filament[23], and the filament–sample interaction could further enhance it. When the sample was after the filament (), the interface nonlinearity and air filament should contribute the THG. Air filament generated THG is much stronger than THG from the surface according to the THG signals measured before and after the filament. Meanwhile, due to high laser intensity as well as high plasma density, more laser energy was deposited to the FIBS process, leading a decrease of fundamental laser intensity in Fig. 2(d). Because of self-phase modulation (SPM) and the plasma effect during laser filamentation, the spectrum of the fundamental pulse was modulated.
During laser filamentation, SPM and the plasma effect will lead to a laser frequency change, for instance, spectrum modulation, red-shift, or blue-shift, as observed in Fig. 2(d). As a consequence, the frequency change of the fundamental wave (Fund) should definitely be related to its THG and SHG waves. The relation has been directly observed in the experiments. Figure 3 presents the peak wavelengths of THG, SHG, and the Fund as a function of the sample position along the laser propagation axis from Figs. 2(b)–2(d). Here, the peak wavelengths of THG, SHG, and the Fund were fixed by manually choosing the maximum intensity value around each peak in the three different spectrum ranges of THG, SHG, and the Fund.
Figure 3.Peak wavelengths of THG, SHG (black), and Fund (red) as a function of the axis: (a) THG around 273 nm and Fund around 825 nm, (b) SHG around 412 nm and Fund around 825 nm.
When the soil sample was in the region before the laser filament (), a clear peak of the Fund was stabilized around 825 nm [Fig. 2(d)]. Under this condition, the THG peaks stabilized at around 275.4 nm [Fig. 3(a)], and the SHG peaks stabilized at around 412 nm [Fig. 3(b)] were observed. Then, during laser filamentation (), the frequency of the Fund has been modulated, leading the peak wavelength shift of the Fund in Fig. 3. In the experiment, clear peak wavelength shifts of the THG have been observed [Fig. 3(a)], which follows well the peak wavelength change of the Fund. The SHG could not be observed because of the surface damage of the sample through laser ablation [Fig. 3(b)], which has been mentioned before. This blue-shift of the Fund may come from the SPM and plasma effect. The back part of the laser pulse contributes to the blue-shift through SPM during laser filamentation[24]. At the same time, laser induced plasmas also contribute the blue-shift of the Fund[25]. Therefore, the blue-shift of THG from the laser filament closely follows the frequency change of the filamenting pulse. When the soil sample was in the region after the filament (), only THG and SHG were generated. This surface THG together with the filament generated THG contributes the total THG at the end, which could be the reason for the different trends of THG and Fund [Fig. 3(a)].
In order to investigate the surface roughness dependence on the harmonic generations, three samples with different surface qualities have been tested. The surface images of the three samples are shown in Fig. 4. Figures 4(a)–4(c) are for the samples of Jiuniugang soil, clay loam soil, and Al plate, respectively. Compared with the Al plate surface [Fig. 4(c)] and the clay loam soil sample [Fig. 4(b)], the surface of the sandy loam soil sample [Fig. 4(a)] is rougher.
Figure 4.(a) Surface images of Jiuniugang soil, (b) clay loam soil, and (c) Al plate.
By using the Jiuniugang’s sample [Fig. 4(a)], the emission angle dependence of the SHG has been investigated. The experimental scheme is shown as the inset of Fig. 5. The femtosecond laser pulse energy was 0.87 mJ, and the soil sample was fixed at before the filament [Fig. 2(a)]. The incidence angle of the laser to the sample was 0° (the laser propagation direction was perpendicular to the soil surface). Collection angle was defined as the angle between the laser propagation direction and the signal collection direction. The peak intensities of SHG as a function of collection angle are shown in Fig. 5 for the wavelengths of 398 and 412 nm, respectively. The corresponding peak intensities of the fundamental wavelengths are also given in Fig. 5 for comparison.
Figure 5.Peak intensities of SHG and Fund as a function of the collecting angle : SHG 398 nm (black), Fund 795 nm (red), SHG 412 nm (blue), and Fund 825 nm (magenta), respectively.
The peak intensities of SHG and the Fund became stronger when the collection direction was close to the laser propagation direction. This result reconfirms the nature of the harmonics observed: the harmonic’s origin from the phase-matched-harmonic generation process can then be observed at other directions through scattering due to the sandy surface of the sample.
In order to further approve the claim, two other samples (clay loam soil and an Al plate) with different surface roughnesses have been studied. The same collection angle of 30°, as in Fig. 2, was used in this trial. The laser pulse energy was 0.4 mJ. Figures 6(a) and 6(b) show the three-dimensional FIBS spectrum diagrams of the Al plate along the Z axis at the spectral ranges of 260 to 280 nm and 390 to 407 nm, respectively. Figures 6(c) and 6(d) are the results for the clay loam soil sample at similar spectral ranges. Atomic emission lines of elements in soil and Al have been clearly observed in the region of the laser filament. There is no SHG signal before and after the laser filament. The only THG in the region after the laser filament, which is from the filamentation process, is in air. As a conclusion, the rough surface of the sample favors the scattered harmonics.
Figure 6.Three-dimensional FIBS spectrum diagram of samples along the laser propagation direction (Z axis): (a) and (b) for the Al plate at the wavelength ranges of 260 to 280 nm and 390 to 407 nm, respectively; (c) and (d) for the clay loam soil sample at the wavelength ranges of 260 to 285 nm and 380 to 410 nm, respectively.
Element spectra from the laser induced breakdown process have been successfully applied for element analysis of materials. In order to look into the relation of the THG and SHG with the element spectrum, two element emission lines of FeI at 252.96 nm and CaII at 396.8 nm in Figs. 2(b) and 2(c) were selected. According to the spectra in Fig. 2, the signal intensities of the THG (peaked at 275 nm), Fe element (at 252.96 nm), SHG (peaked at 412.3 nm), and Ca element (at 396.8 nm) as a function of the Z axis are shown in Fig. 7.
Figure 7.Spectral peak intensities of the soil element and the harmonic waves as a function of the sample position along the laser propagation (Z axis):FeI 252.96 nm (black), THG 275 nm (red), CaII 396.8 nm (blue), and SHG 412.3 nm (magenta).
The signals of the element spectral lines (FeI 252.96 nm, CaII 396.8 nm) start to appear only in the region of the laser filament ( in Fig. 7), where the laser intensity is high enough to excite them. The THG and SHG from the laser interaction with the sample surface exist in the regions before and after the laser filament, where the laser intensity is high enough for surface-harmonic generation, but not for element excitation. The element spectral signals are proportional to the THG from the laser filament. The SHG has a reverse behavior and cannot be detected because of surface ablation. When the sample was in the region of the filament, THG was much stronger than the one after. Beside the correction of phase mismatching due to the Gouy phase shift[19], the filament–soil interaction may also enhance the THG. The THG measured in the region after the filament was stronger ( order) than before the filament, which should come from the air filament. Looking into the THG and SHG from the laser interaction with a rough surface sample opens a way to indirectly determine both the FIBS signal intensity and the interaction region.
In conclusion, we study the evolution of the surface-harmonic wave and the sample element spectrum when the sample is moved along the filament. Surface THG and SHG on air and sandy soil interfaces are observed in the directions of non-phase matching when the soil is in the region of pre- and post-filamentation. No emission signals of soil elements spectral lines appear because of the relatively low laser intensity. The surface harmonics are not observed and instead the fluorescence signals of soil elements are excited when the sample is in the region of the laser filament. The surface THG and SHG own the frequency blue-shift along the filament and are highly related to the surface roughness of the sample. The results reported in this work can be useful for the understanding of laser filament interaction with solids and the application on FIBS.
References
[1] G. Galbacs. Anal. Bioanal. Chem., 407, 7537(2015).
[2] K. Stelmaszczyk, P. Rohwetter, G. Mejean, J. Yu, E. Salmon, J. Kasparian, R. Ackermann, J. P. Wolf, L. Woste. Appl. Phys. Lett., 85, 3977(2004).
[3] S. L. Chin, T. J. Wang, C. Marceau, J. Wu, J. S. Liu, O. Kosareva, N. Panov, Y. P. Chen, J. F. Daigle, S. Yuan, A. Azarm, W. W. Liu, T. Seideman, H. P. Zeng, M. Richardson, R. Li, Z. Z. Xu. Laser Phys., 22, 1(2012).
[4] Y. Liu, H. Sun, J. Ju, Y. Tian, Y. Bai, C. Wang, T. Wang, J. Liu, S. Chin, R. Li. Chin. Opt. Lett., 14, 031401(2016).
[5] Y. X. Wei, Y. X. Liu, T. J. Wang, N. Chen, J. J. Ju, Y. H. Liu, H. Y. Sun, C. Wang, J. S. Liu, H. H. Lu, S. L. Chin, R. X. Li. High Power Laser Sci. Eng., 4, e8(2016).
[6] H. L. Xu, W. Liu, S. L. Chin. Opt. Lett., 31, 1540(2006).
[7] J. Kasparian, R. Sauerbrey, S. L. Chin. Appl. Phys. B-Lasers O, 71, 877(2000).
[8] B. N. Chichkov, C. Momma, S. Nolte, F. von Alvensleben, A. Tunnermann. Appl. Phys. A-Mater., 63, 109(1996).
[9] T. J. Wang, H. L. Xu, J. F. Daigle, A. Sridharan, S. Yuan, S. L. Chin. Opt. Lett., 37, 1706(2012).
[10] H. L. Xu, Y. Cheng, S. L. Chin, H. B. Sun. Laser Photon. Rev., 9, 275(2015).
[11] C. P. Lu, W. Q. Liu, N. J. Zhao, L. T. Liu, D. Chen, Y. J. Zhang, J. G. Liu. Acta Phys. Sin-Ch Ed., 60, 045206(2011).
[12] R. W. Terhune, P. D. Maker, C. M. Savage. Phys. Rev. Lett., 8, 404(1962).
[13] N. Bloember, R. K. Chang, S. S. Jha, C. H. Lee. Phys. Rev., 174, 813(1968).
[14] C. K. Chen, A. R. B. Decastro, Y. R. Shen. Phys. Rev. Lett., 46, 145(1981).
[15] T. Y. F. Tsang. Phys. Rev. A, 52, 4116(1995).
[16] P. Guyotsionnest, Y. R. Shen. Phys. Rev. B, 35, 4420(1987).
[17] F. Liang, Q. Sun, R. Vallee, S. L. Chin. Appl. Phys. B-Lasers O, 99, 235(2010).
[18] J. B. Sirven, B. Bousquet, L. Canioni, L. Sarger. Spectrochim. Acta B, 59, 1033(2004).
[19] R. Boyd. Nonlinear Optics(2008).
[20] M. Beresna, P. G. Kazansky, Y. Svirko, M. Barkauskas, R. Danielius. Appl. Phys. Lett., 95, 121502(2009).
[21] G. H. Li, J. L. Ni, H. Q. Xie, B. Zeng, J. P. Yao, W. Chu, H. S. Zhang, C. R. Jing, F. He, H. L. Xu, Y. Cheng, Z. Z. Xu, G. H. Li. Opt. Lett., 39, 961(2014).
[22] H. Yang, J. Zhang, J. Zhang, L. Z. Zhao, Y. J. Li, H. Teng, Y. T. Li, Z. H. Wang, Z. L. Chen, Z. Y. Wei, J. X. Ma, W. Yu, Z. M. Sheng. Phys. Rev. E, 67, 015401(2003).
[23] J. P. Yao, B. Zeng, W. Chu, J. L. Ni, Y. Cheng. J. Modern Opt., 59, 245(2012).
[24] N. Akozbek, A. Iwasaki, A. Becker, M. Scalora, S. L. Chin, C. M. Bowden. Phys. Rev. Lett., 89, 143901(2002).
[25] S. L. Chin, A. Brodeur, S. Petit, O. G. Kosareva, V. P. Kandidov. J. Nonlinear Opt. Phys., 8, 121(1999).