
Shihao Guan, Guang Yang, Shan Lu, Yanyu Fu. Multi-Objective Optimization of Hyperspectral Band Selection Based on Attention Mechanism[J]. Acta Optica Sinica, 2020, 40(21): 2128002
- Acta Optica Sinica
- Vol. 40, Issue 21, 2128002 (2020)
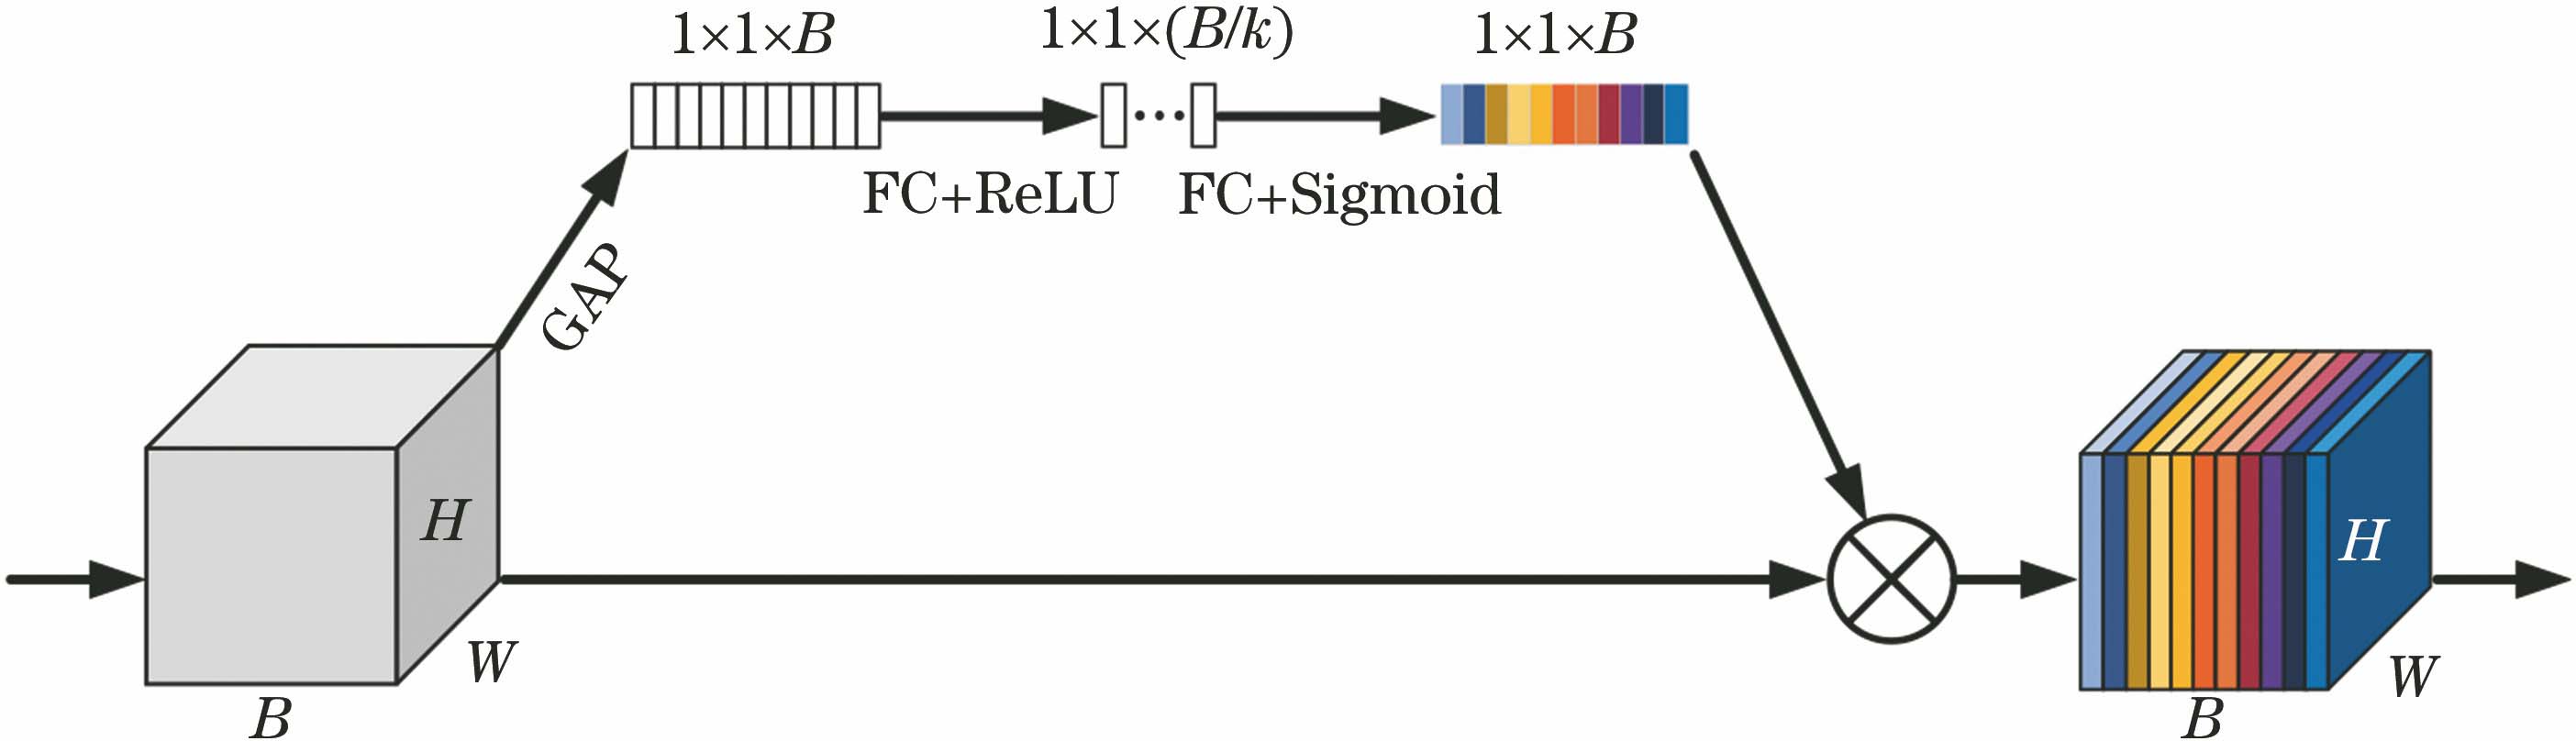
Fig. 1. SENet structure
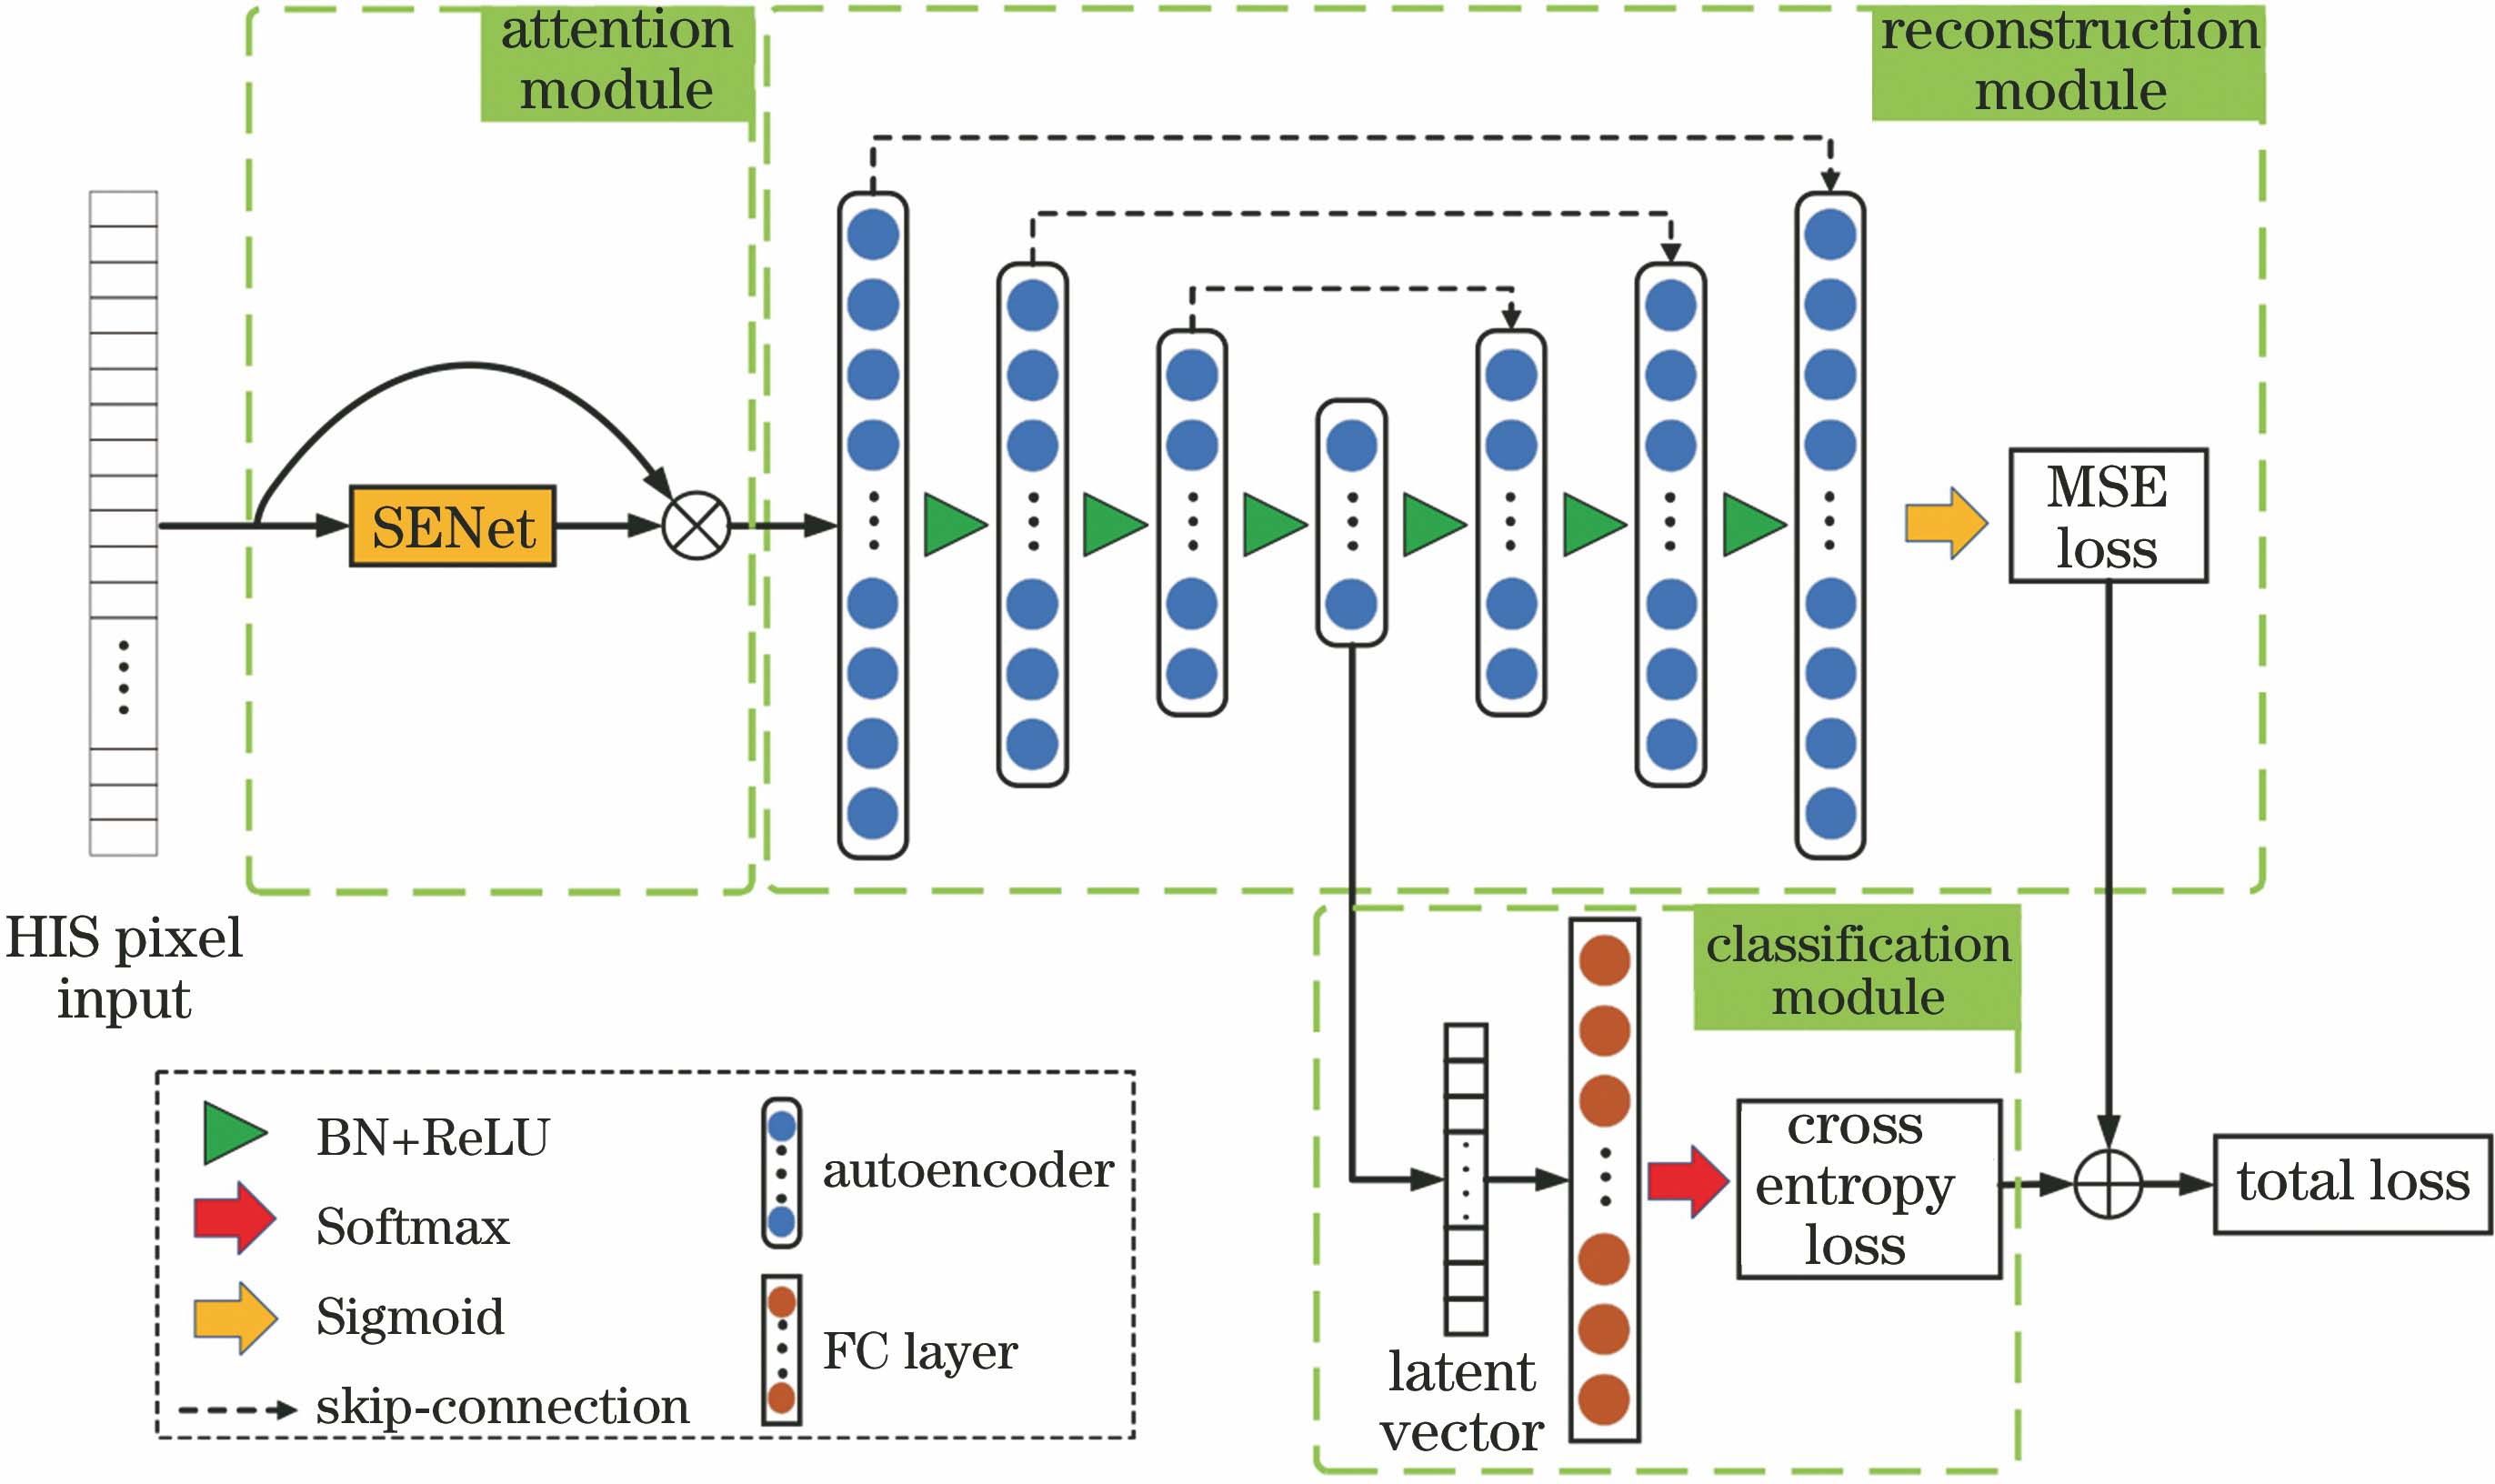
Fig. 2. Band selection model structure
Fig. 3. True color image and ground truth map of Botswana data set. (a) True color image; (b) ground truth map
Fig. 4. True color image and ground truth map of Indian Pines data set. (a) True color image; (b) ground truth map
Fig. 5. SENet structure in the experiment
Fig. 6. Overall classification accuracy, training loss, and band weight changes in the Botswana data set. (a) Overall classification accuracy; (b) training loss; (c) band weight thermal map
Fig. 7. Overall classification accuracy, training loss and band weight changes on the Indian Pines data set. (a) Overall classification accuracy; (b) training loss; (c) band weight thermal map
Fig. 8. Overall classification accuracy, average classification accuracy and Kappa coefficient of each algorithm in the Botswana data set. (a) Overall classification accuracy; (b) average classification accuracy; (c) Kappa coefficient
Fig. 9. Average spectral divergence of each algorithm on the Botswana data set
Fig. 10. Overall classification accuracy, average classification accuracy and Kappa coefficient of each algorithm in the Indian Pines data set. (a) Overall classification accuracy; (b) average classification accuracy; (c) Kappa coefficient
Fig. 11. Average spectral divergence of each algorithm on the Indian Pines data set
|
Table 1. Data size and activation function change in the model
|
Table 2. Hyperspectral image data set
| ||||||||||||||||||||||||||||||||||||||||||||||||||||||||||||||||||||||||||||||||
Table 3. Experimental results of two data sets with different weight coefficients

Set citation alerts for the article
Please enter your email address
© Copyright 2018-2021 | Chinese Laser Press. All Rights Reserved 沪ICP备15018463号-20