
Chen Shi, Xiaolin Wang, Pu Zhou, Xiaojun Xu. Theoretical study of stimulated Raman scattering in long tapered fiber amplifier[J]. Chinese Optics Letters, 2017, 15(11): 110605
- Chinese Optics Letters
- Vol. 15, Issue 11, 110605 (2017)
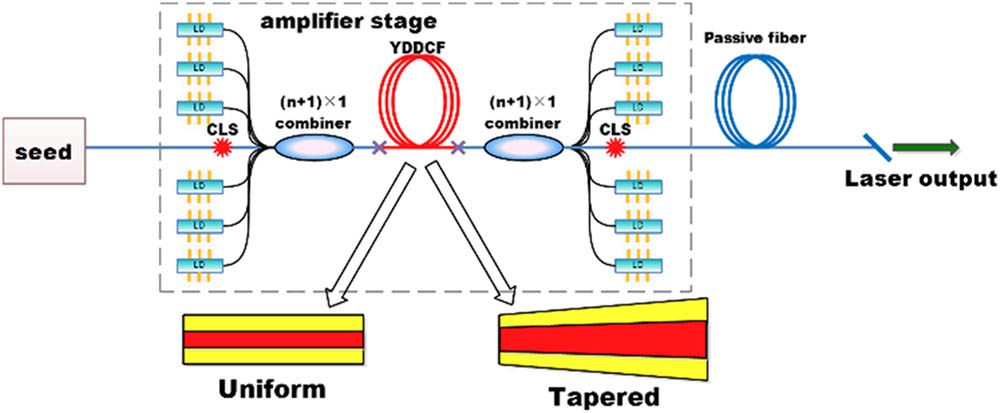
Fig. 1. Simulation configuration of our fiber amplifier.
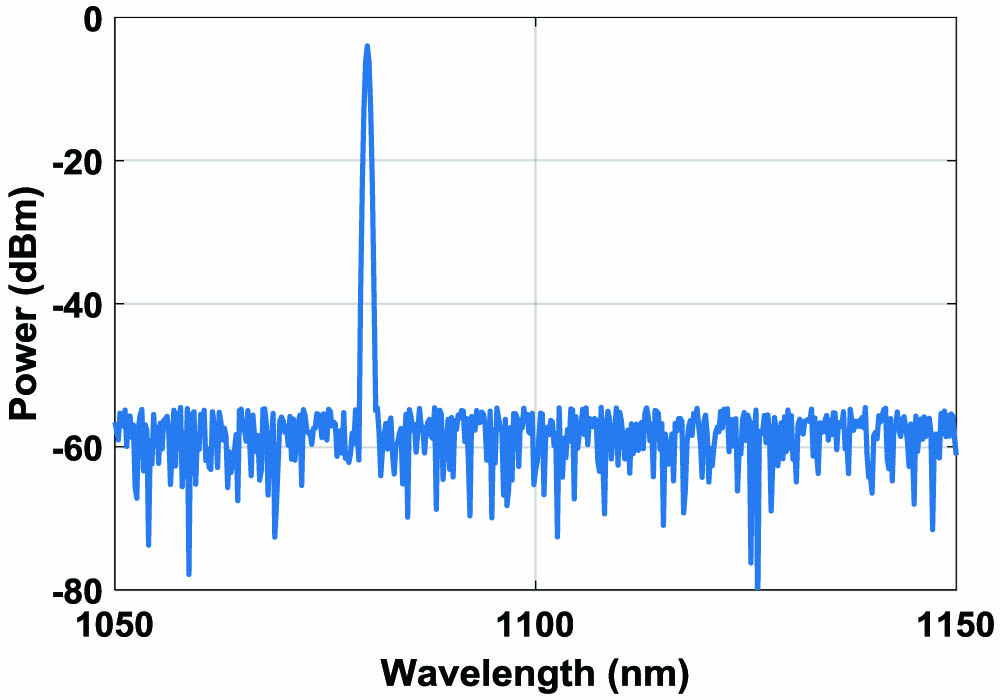
Fig. 2. Calculated seed spectrum in the simulation.
Fig. 3. (Color online) Simulation results of the 20/400 uniform fiber. (a) Output spectra from output port of the passive fiber. (b) Output spectra from output port of the active fiber. (c) Raman power variation along with fiber position.
Fig. 4. (Color online) Simulation results of the 30/400 uniform fiber. (a) Output spectra from the output port of the passive fiber. (b) Output spectra from the output port of the active fiber. (c) Raman power variation along with fiber position.
Fig. 5. (Color online) Illustration of the core diameter variation of concave, linear, and convex tapered fibers.
Fig. 6. (Color online) Simulation results of tapered fibers with different shaping factors. Left column, output spectra from the passive fiber output port; right column, output spectra from the active fiber output port. (a) Concave (b = 0 b = b 0 b = 2 b 0
Fig. 7. (Color online) Raman power and Raman ratio variation inside active fibers. (a) Concave (b = 0 b = b 0 b = 2 b 0
|
Table 1. Basic Simulation Parameters

Set citation alerts for the article
Please enter your email address
© Copyright 2018-2021 | Chinese Laser Press. All Rights Reserved 沪ICP备15018463号-20