Chen Shi, Xiaolin Wang, Pu Zhou, Xiaojun Xu, "Theoretical study of stimulated Raman scattering in long tapered fiber amplifier," Chin. Opt. Lett. 15, 110605 (2017)
Copy Citation Text
A model that is based on the propagation equation and coupled mode theory is introduced in order to describe stimulated Raman scattering (SRS) effects in long tapered fiber amplifiers. Based on the presented model, fiber amplifiers with uniform and long tapered fibers are theoretically and numerically simulated. It can be drawn from the results of our simulations that the long tapered fiber has the advantage in suppressing SRS when applied in fiber laser amplifiers. Our results can provide guidance in the designing of system configuration in long tapered-fiber-based fiber laser systems.
For the advantage of high slope efficiency, good beam quality, superior thermal management property, and compactness, fiber lasers are widely used in the field of laser marking, material processing, medical, communication, and many other industrial applications[1–3]. Compared with the traditional fiber laser oscillator, the master oscillator power amplifier (MOPA) system, which can boost the progress of fiber laser power scaling, offers an effective way to acquire a high power fiber laser source with excellent beam quality by employing a cascaded structure[4–6]. In comparison with a traditional uniform large-mode-area (LMA) active fiber, the long tapered double clad fiber (T-DCF) shows numerous unique advantages when being employed as gain medium of an optical amplifier, such as LMA, higher pump absorption, suppression to nonlinear effects, maintaining good beam quality, and so on[7]. Some experimental and theoretical studies on long T-DCF-based fiber lasers have already been presented by earlier researchers, including the continuous-wave (CW) regime[8–11], pulsed regime[12,13], mode propagating properties[14,15], and so on. However, among these previous researches, there is hardly a systematic analysis for nonlinearities in long T-DCF-based fiber laser systems. The stimulated Raman scattering (SRS) effect is one of the dominant nonlinear effects in high power fiber lasers, which usually sets the upper limit of the power scalability of the whole system[16]. In order to fully understand the performance of long T-DCF-based fiber lasers, the analysis of the SRS effect in long T-DCF is needed.
Consider the fiber amplifier, which launches under the CW regime. By ignoring self-phase modulation (SPM), cross-phase modulation (XPM), four-wave mixing (FWM), and stimulated Brillioun scattering (SBS), the propagation equation of uniform fiber amplifier can be written as where represents the complex amplitude of the corresponding eigenmode and wavelength. The subscript of stands for different boundary modes, while the superscript (, ) stands for different signal wavelengths. is the propagating constant of the corresponding . is the effective area between different modes in different wavelengths, and it is defined as follows: where is the normalized modal distribution of the corresponding boundary mode. The symbol means integrating over the infinite transverse cross section. is the Raman gain, which can be calculated using[17]where is the nonlinear parameter. is the fractional Raman contribution in silicon-based fibers. is the frequency domain Raman response function, and it can be expressed as where is the frequency difference between the pump and Raman wavelengths. and are the parameters that used to fit the Raman response function. Now, we will further consider the situation in the long tapered fiber. In this situation, the modal distribution will gradually alter along with the position of the fiber. According to Ref. [15], the mode variation in the long tapered fiber can be described as where and are the mode coupling coefficients, which are induced by the radius and variation and slight perturbation, respectively. By combining Eqs. (1) and (5), the SRS process in the long tapered fiber can be described by following equation:
Equation (6) is the general expression that can describe SRS excitation in the long tapered fiber. As we can see, the modal amplitude variation is contained by the propagating constant, local gain, loss (background loss, curvature, etc.), intermodal coupling (tapered induced and slight perturbation induced), and Raman gain.
Sign up for Chinese Optics Letters TOC. Get the latest issue of Chinese Optics Letters delivered right to you!Sign up now
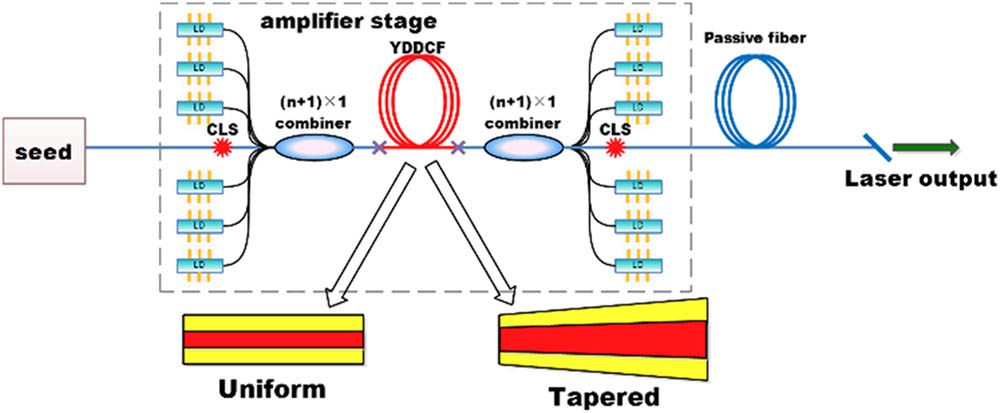
Before the numerical simulation, we have to do some reasonable assumptions to the original model. First, the simulation will only consider the small-to-large (S-L, which means the signal power will be injected into amplifier stage from the small end of the T-DCF) scheme. Second, according to Ref. [15], we can safely ignore intermodal coupling coefficient and because of the relatively low higher-order-mode excitation in the S-L configuration. Third, the background absorption loss and curvature loss will also be ignored here. Lastly, because of that, the signal light injected into the small end of the long tapered fiber is diffraction limited, the effective overlapping area will be regarded as a constant to fiber core radius and will be proportional to the actual fiber core area. The configuration of simulated amplifier is plotted in Fig. 1.
Figure 1.Simulation configuration of our fiber amplifier.
As shown in Fig. 1, our simulation is based on an MOPA structure. The signal wavelength is set to 1080 nm, the power of seed laser is 500 W, and the spectrum of the seed laser is shown in Fig. 2.
Figure 2.Calculated seed spectrum in the simulation.
The amplification stage is bidirectionally pumped, and a piece of active fiber is inserted between the forward and backward pumping combiners. For convenience, we assume that the active fiber is ytterbium-doped. The pumping wavelength is set to 976 nm. Before the laser output port, a piece of passive fiber is added in order to guarantee effective Raman excitation, so we can compare SRS in a relatively low power level. It is worth noting that we always make the core radius of the passive fiber match with the dimension of the output port of the active fiber. The parameters that we used in our simulation are listed in Table 1.
The total pumping power means that the total forward and backward pumping power will be limited to 5000 W. Here, we define three different pumping configurations for our simulations: forward pump (FP, forward 5000 W plus backward 0 W), bidirectional pump (BIP, forward 2500 W plus backward 2500 W), and backward pump (BP, forward 0 W plus backward 5000 W).
In order to reveal the SRS performance of the long tapered fiber, we first calculate the SRS performance of a uniform fiber for comparison. In this case, two different types of fiber, 20/400 and 30/400, are used. The simulation results of the 20/400 active fiber are plotted in Fig. 3.
Figure 3.(Color online) Simulation results of the 20/400 uniform fiber. (a) Output spectra from output port of the passive fiber. (b) Output spectra from output port of the active fiber. (c) Raman power variation along with fiber position.
As we can see from Fig. 3(a), the spectra of three different pumping methods are exactly the same, where almost all of the signal powers are converted into Raman–Stokes light. The peak intensity of the Raman wavelength is even higher than the signal laser itself. This strong conversion is mainly contributed by the 20 m long passive fiber. The vertical dashed line in Fig. 3(c) indicates the conjunction position of the active and passive fibers. It is worth noting that the Raman wavelength range we considered when calculating Raman power is 1110–1150 nm. From Figs. 3(b) and 3(c), it is obvious that the Raman power is much lower at the output port of the active fiber.
The simulation results of the 30/400 fiber are plotted in Fig. 4.
Figure 4.(Color online) Simulation results of the 30/400 uniform fiber. (a) Output spectra from the output port of the passive fiber. (b) Output spectra from the output port of the active fiber. (c) Raman power variation along with fiber position.
Because of a larger core diameter, the intensity of Raman power in the 30/400 case is much lower than the simulation results of the 20/400 fiber. From Fig. 4(c), we can see that the Raman power is also contributed to by the passive fiber. It is very interesting to see that the Raman intensity varies with the change of pumping schemes in both testing cases. The FP scheme has the most intense Raman intensity among all three pumping schemes. Then, the Raman intensity of the BIP scheme is the second strongest. The BP scheme has the weakest Raman intensity. This difference should mainly be induced by the different signal power variation trends of the three pumping schemes. In the forward and BIP schemes, the signal power will be amplified quickly in the active fiber, which will lead to longer interaction length of the Raman-Stokes conversion process.
In this part, we will discuss the performance of SRS in long tapered fibers. First, we have to define the parameters we use to describe the tapered fibers. We define the core radius of the small end and large end of the tapered fiber as and , respectively. Assume that the total length of tapered fiber is , so an average tapering angle could be defined as
Then, the relationship between the core radius and fiber position is defined as
Here, is the parabolic shaping factor that describes the shape of the taper. According to the relative value of and , tapered fibers can be divided into three categories, , , and correspond to convex, linear, and concave tapered fibers, respectively. All three types are plotted in the illustration in Fig. 5.
Figure 5.(Color online) Illustration of the core diameter variation of concave, linear, and convex tapered fibers.
All long tapered fibers with a more complex profile can be approximated by these three types of profiles. Based on the statement above, our numerical simulation will concern these three types of tapered fibers. In our simulation, the diameter of the small end and large end are set to 20 and 45 μm, respectively. The total length of the tapered fiber is the same as the uniform fiber because we assume that the average pump absorption is also . Figure 6 shows the simulated output spectra of the three different shaped tapered fibers.
Figure 6.(Color online) Simulation results of tapered fibers with different shaping factors. Left column, output spectra from the passive fiber output port; right column, output spectra from the active fiber output port. (a) Concave (), (b) linear (), and (c) convex ().
As we can see from Fig. 6, and comparing the output spectra with Figs. 3 and 4, we can find that the SRS intensity in tapered fibers is much weaker than that in normal uniform fibers, especially at the output port of the passive fiber. This reveals a truth that the long tapered fiber has the advantage of matching LMA passive fibers in a power delivering system. In the practical use of a fiber laser system, the output system which contains a 10 m or longer passive fiber, is inevitably added in order to deliver the energy. As we analyzed and discussed above, the passive fiber usually makes more contributions in the Raman-Stokes conversion procedure. Also, the situations in the three different pumping schemes are almost the same as that in uniform fibers, which means BP would have a better performance in SRS prevention. As for the SRS performance of the active fiber itself, the Raman power variation in active fibers is plotted in Fig. 7.
Figure 7.(Color online) Raman power and Raman ratio variation inside active fibers. (a) Concave (), (b) linear (), (c) convex (), (d) 20 μm uniform fiber, and (e) 30 μm uniform fiber.
As shown in Fig. 7, we can see that both the linear and convex type tapered fiber has weaker SRS intensity compared with uniform fibers. The concave type tapered fiber is a little worse than the uniform fiber with a 30 μm core diameter, but this difference could be a set-back due to previous passive fiber dimensions. By comparing Figs. 7(a)–7(c), we can see that the convex type tapered fiber has the advantage in SRS prevention. With the increment of parabolic shaping factor , the SRS intensity is experiencing a reduction procedure.
In conclusion, we introduce a model based on the propagation equation and coupled mode theory to describe SRS effects in a long tapered fiber. Based on the presented model, fiber amplifiers with different factors are theoretically and numerically investigated. The long tapered fiber has the advantage in mitigation of the SRS effect, according to our simulations. Our results can provide guidance in the designing of a system configuration in long tapered-fiber-based fiber laser systems.
Chen Shi, Xiaolin Wang, Pu Zhou, Xiaojun Xu, "Theoretical study of stimulated Raman scattering in long tapered fiber amplifier," Chin. Opt. Lett. 15, 110605 (2017)