
Song Peng, Liu Chun, Zhu Lei, Zhang Lijian, Zhang Xiaodan. Analysis of Single-Scatter Path Loss in Wireless Ultraviolet Communication in Mobile Scene[J]. Acta Optica Sinica, 2020, 40(4): 406001
- Acta Optica Sinica
- Vol. 40, Issue 4, 406001 (2020)
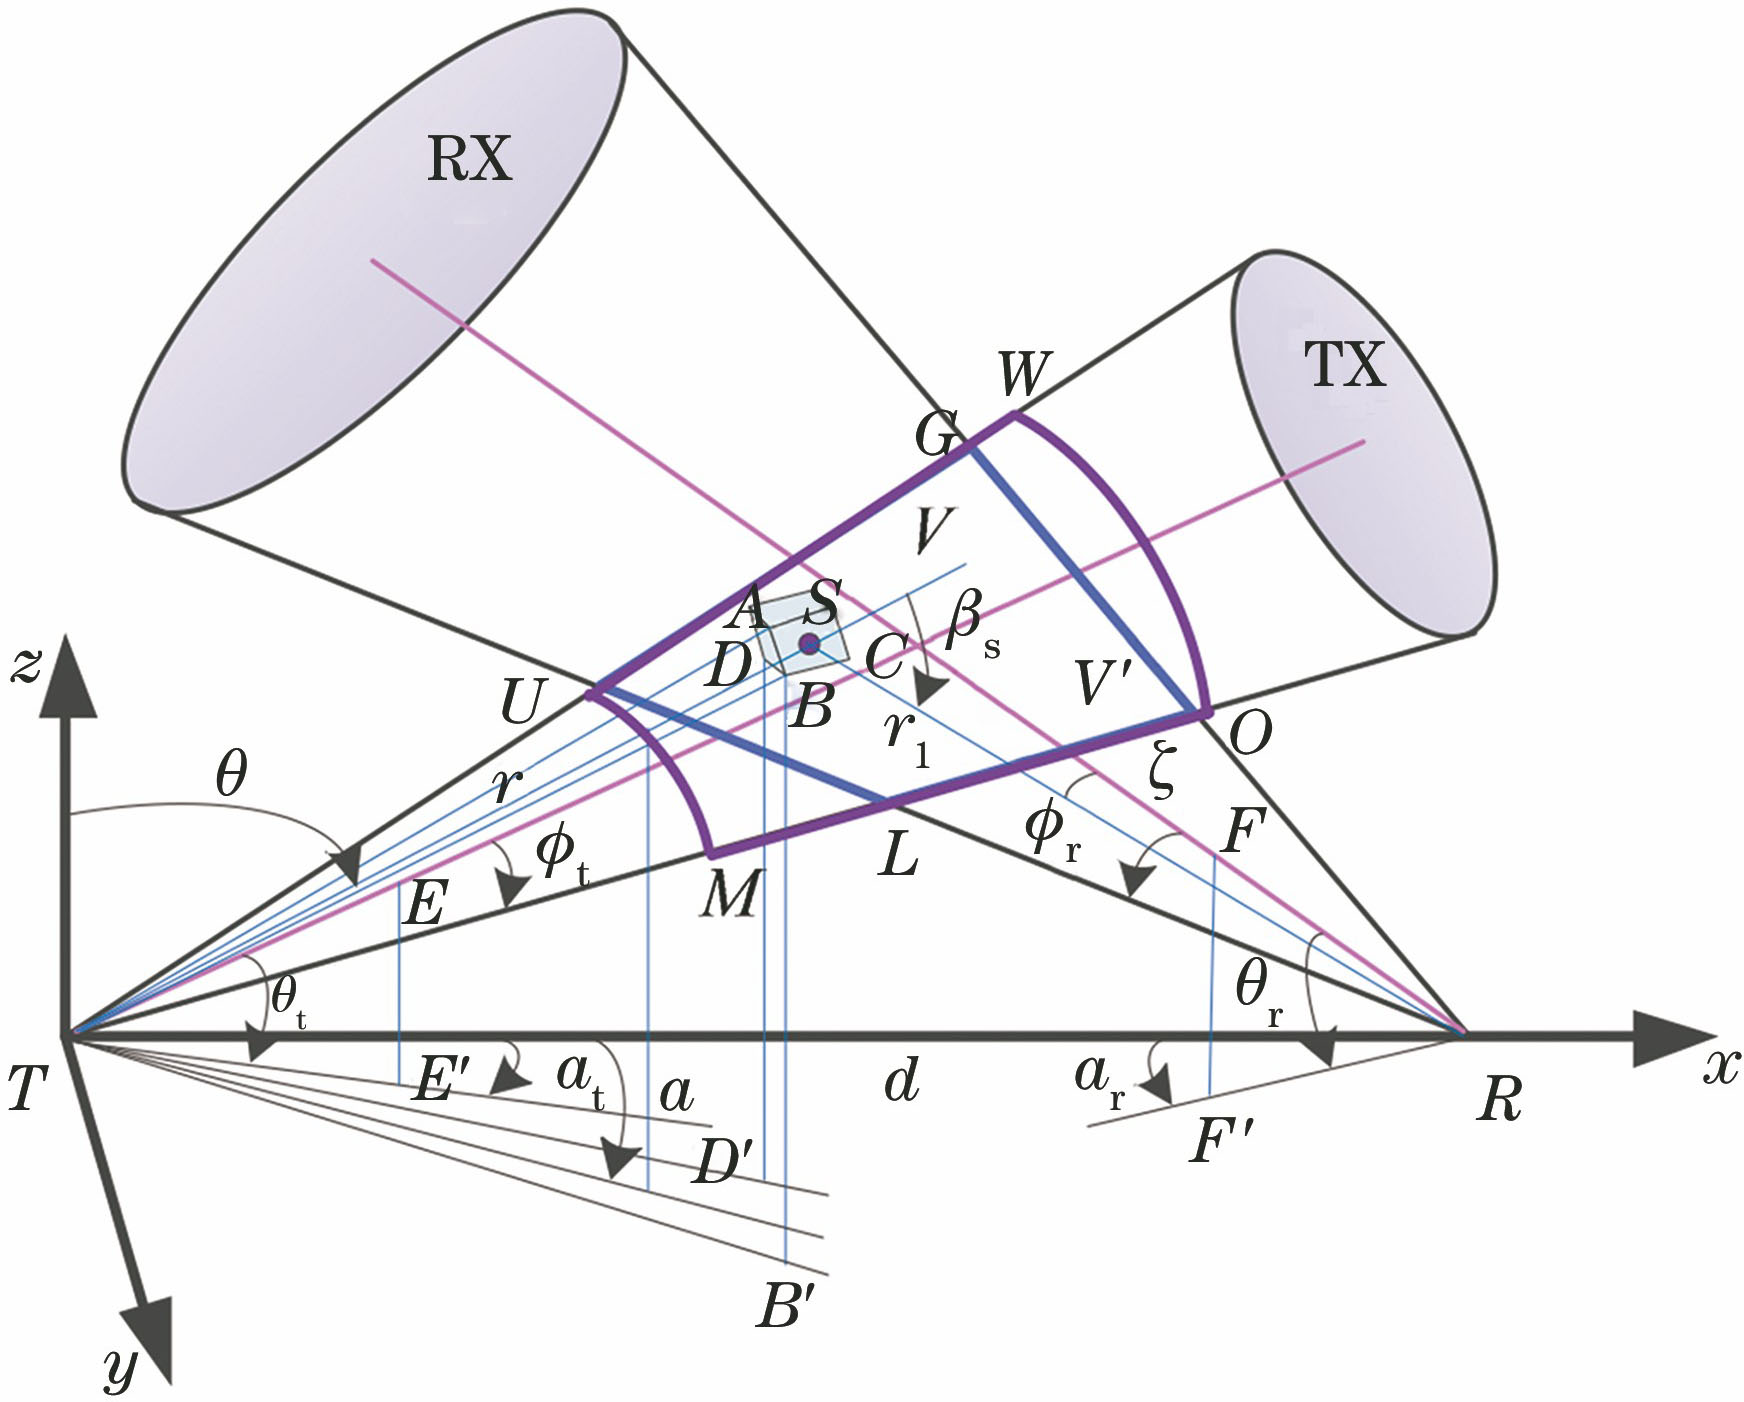
Fig. 1. NLOS UV single-scatter propagation model in non-coplanar geometry
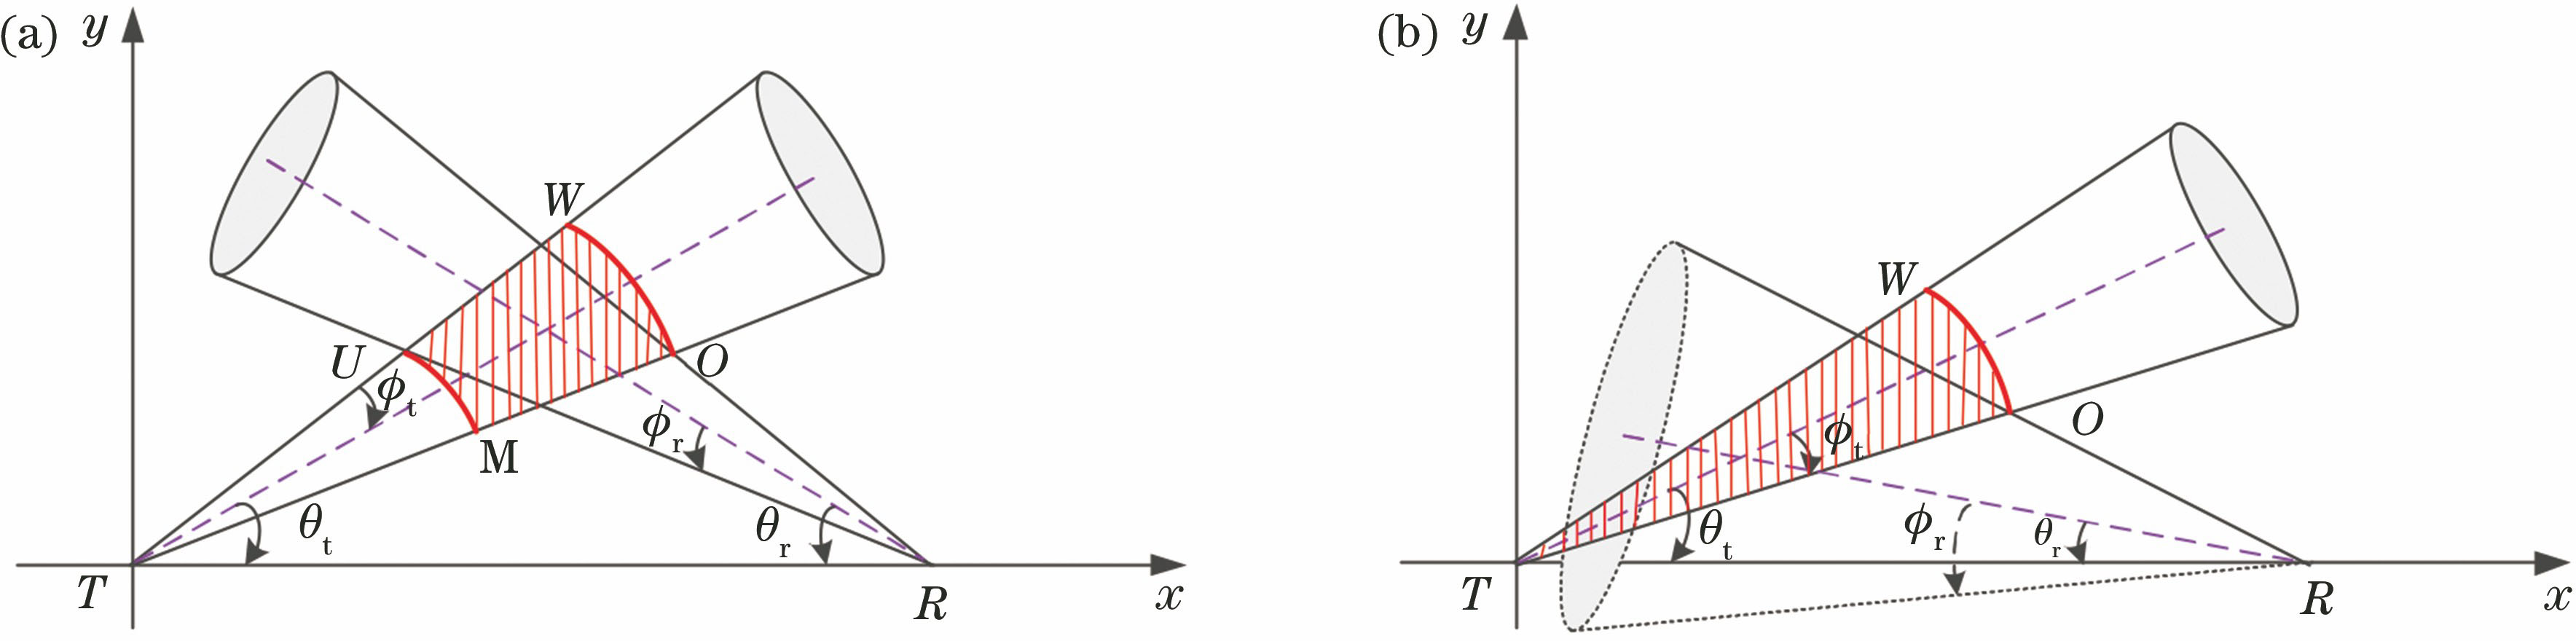
Fig. 2. Determine the upper and lower limits of r. (a) Situation 1; (b) situation 2
Fig. 3. Determine the upper and lower limits of θ and α. (a) Situation 1; (b) situation 2
Fig. 4. Schematic diagram of the center point of micro element V″ in the non-line-of-sight non-coplanar ultraviolet single-scatter transmission model
Fig. 5. Schematic diagram of research
Fig. 6. Influence of node's position change on path loss
Fig. 7. Comparison of simulation results between TTUM and MC method
Fig. 8. Influence of elevation angle change of transmitter on path loss. (a) 0° path; (b) 45° path; (c) 90° path; (d) 135° path; (e) 180° path
Fig. 9. Influence of elevation angle change of receiver on path loss. (a) 0° path; (b) 45° path; (c) 90° path; (d) 135° path; (e) 180° path
Fig. 10. Influence of elevation angle consistent change of transceiver on path loss. (a) 0° path; (b) 45° path; (c) 90° path; (d) 135° path; (e) 180° path
Fig. 11. Influence of beam divergence angle change on path loss. (a) 0° path; (b) 45° path; (c) 90° path; (d) 135° path; (e) 180° path
Fig. 12. Influence of FOV angle change on path loss. (a) 0° path; (b) 45° path; (c) 90° path; (d) 135° path; (e) 180° path
|
Table 1. Part of simulation parameters
|
Table 2. Value of V when the receiver moves in 180° direction
| |||||||||||||||||||||||||||||||||||||||||||||||||||||||||||||||||||||||||||||||||||||||||
Table 3. Contrast data between TTUM and MC

Set citation alerts for the article
Please enter your email address
© Copyright 2018-2021 | Chinese Laser Press. All Rights Reserved 沪ICP备15018463号-20