
Zheyuan Fan, Yuanyuan Wang, Weijun Li, Mingzhou Yu, Yuner Pang. Difference in Optical Properties of Black Carbon Aerosols Simulated by Different Numerical Models[J]. Acta Optica Sinica, 2023, 43(6): 0601004
- Acta Optica Sinica
- Vol. 43, Issue 6, 0601004 (2023)
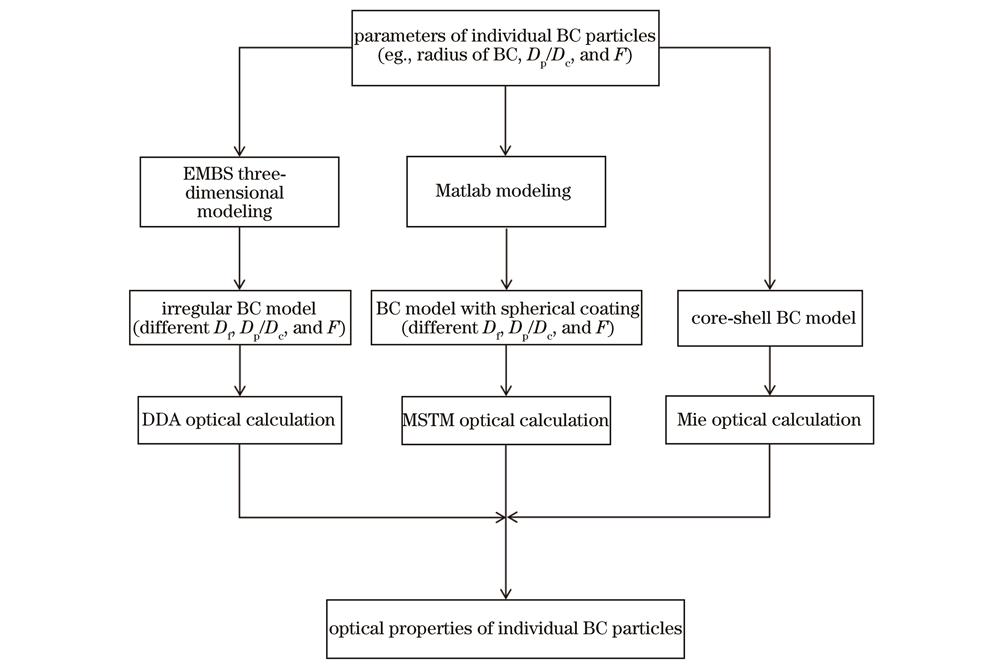
Fig. 1. Flow chart of experimental methods
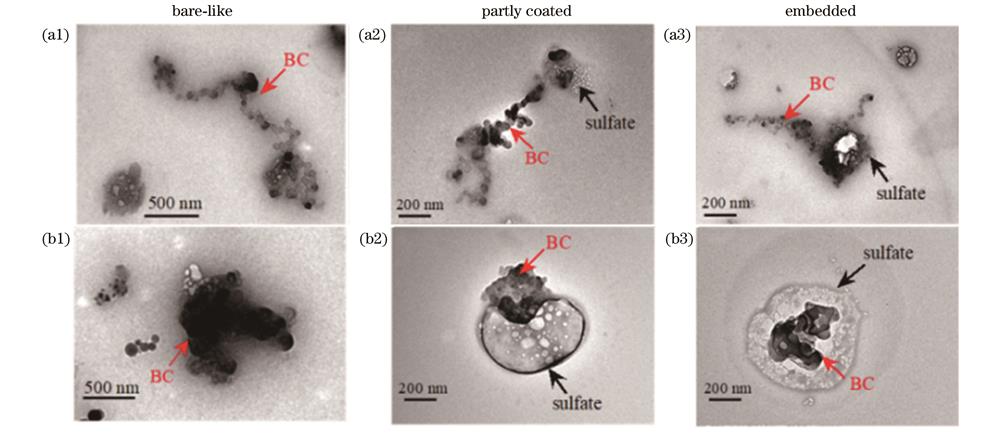
Fig. 2. Transmission electron microscope images of loose and compact BC single particles with different mixing structures. (a1)-(a3) Loose BC particles; (b1)-(b3) compact BC particles
Fig. 3. BC single particle models constructed by EMBS with different coating thickness and coating degree. (a) BC single particle models with Df=1.8; (b) BC single particle models with Df=2.6
Fig. 4. Eabs of BC single particles with different mixing structures calculated by DDA, MSTM, and Mie methods. (a) Eabs obtained by DDA, MSTM, and Mie methods when Df=1.8; (b) Eabs obtained by DDA, MSTM, and Mie methods when Df=2.6
Fig. 5. SSA of BC single particles with different mixing structures calculated by DDA, MSTM, and Mie methods. (a) SSA of DDA, MSTM, and Mie methods when Df=1.8; (b) SSA of DDA, MSTM, and Mie methods when Df=2.6
Fig. 6. Absorption cross section Cabs and absorption efficiency Qabs of BC single particles without coating (Df=2.6). (a) Absorption cross section Cabs of BC; (b) absorption efficiency Qabs of BC
Fig. 7. Eabs, Cabs, and SSA of BC single particles (Df=2.6, Dp/Dc=2.3, and F=1.00). (a) Eabs; (b) Cabs; (c) SSA
Fig. 8. Eabs, Cabs, and SSA when Df =2.6, Dp/Dc=2.3, and F=0.50. (a) Eabs; (b) Cabs; (c) SSA

Set citation alerts for the article
Please enter your email address
© Copyright 2018-2021 | Chinese Laser Press. All Rights Reserved 沪ICP备15018463号-20