• Acta Optica Sinica
  • Vol. 42, Issue 1, 0111001 (2022)
Kang An1、2, Wenfang Li1、2, Xiaojiao Duan1、2, Shilin Wu1、2, Rifeng Zhou1、2, and Jue Wang1、2、*
Author Affiliations
  • 1Key Laboratory of Optoelectronic Technology and System, Ministry of Education, College of Optoelectronic Engineering, Chongqing University, Chongqing 400044, China
  • 2Engineering Research Center of Industrial CT Nondestructive Testing of Ministry of Education, Chongqing 400044, China
  • show less
    DOI: 10.3788/AOS202242.0111001 Cite this Article Set citation alerts
    Kang An, Wenfang Li, Xiaojiao Duan, Shilin Wu, Rifeng Zhou, Jue Wang. Fiber-Coupled GAGG_Ce X-ray Detector for High-Resolution Imaging[J]. Acta Optica Sinica, 2022, 42(1): 0111001 Copy Citation Text show less
    Schematic diagram of signal crosstalk in scintillation screen. (a) Schematic diagram of X-ray scattering crosstalk and fluorescence crosstalk; (b) response distribution of CCD pixel to fluorescence
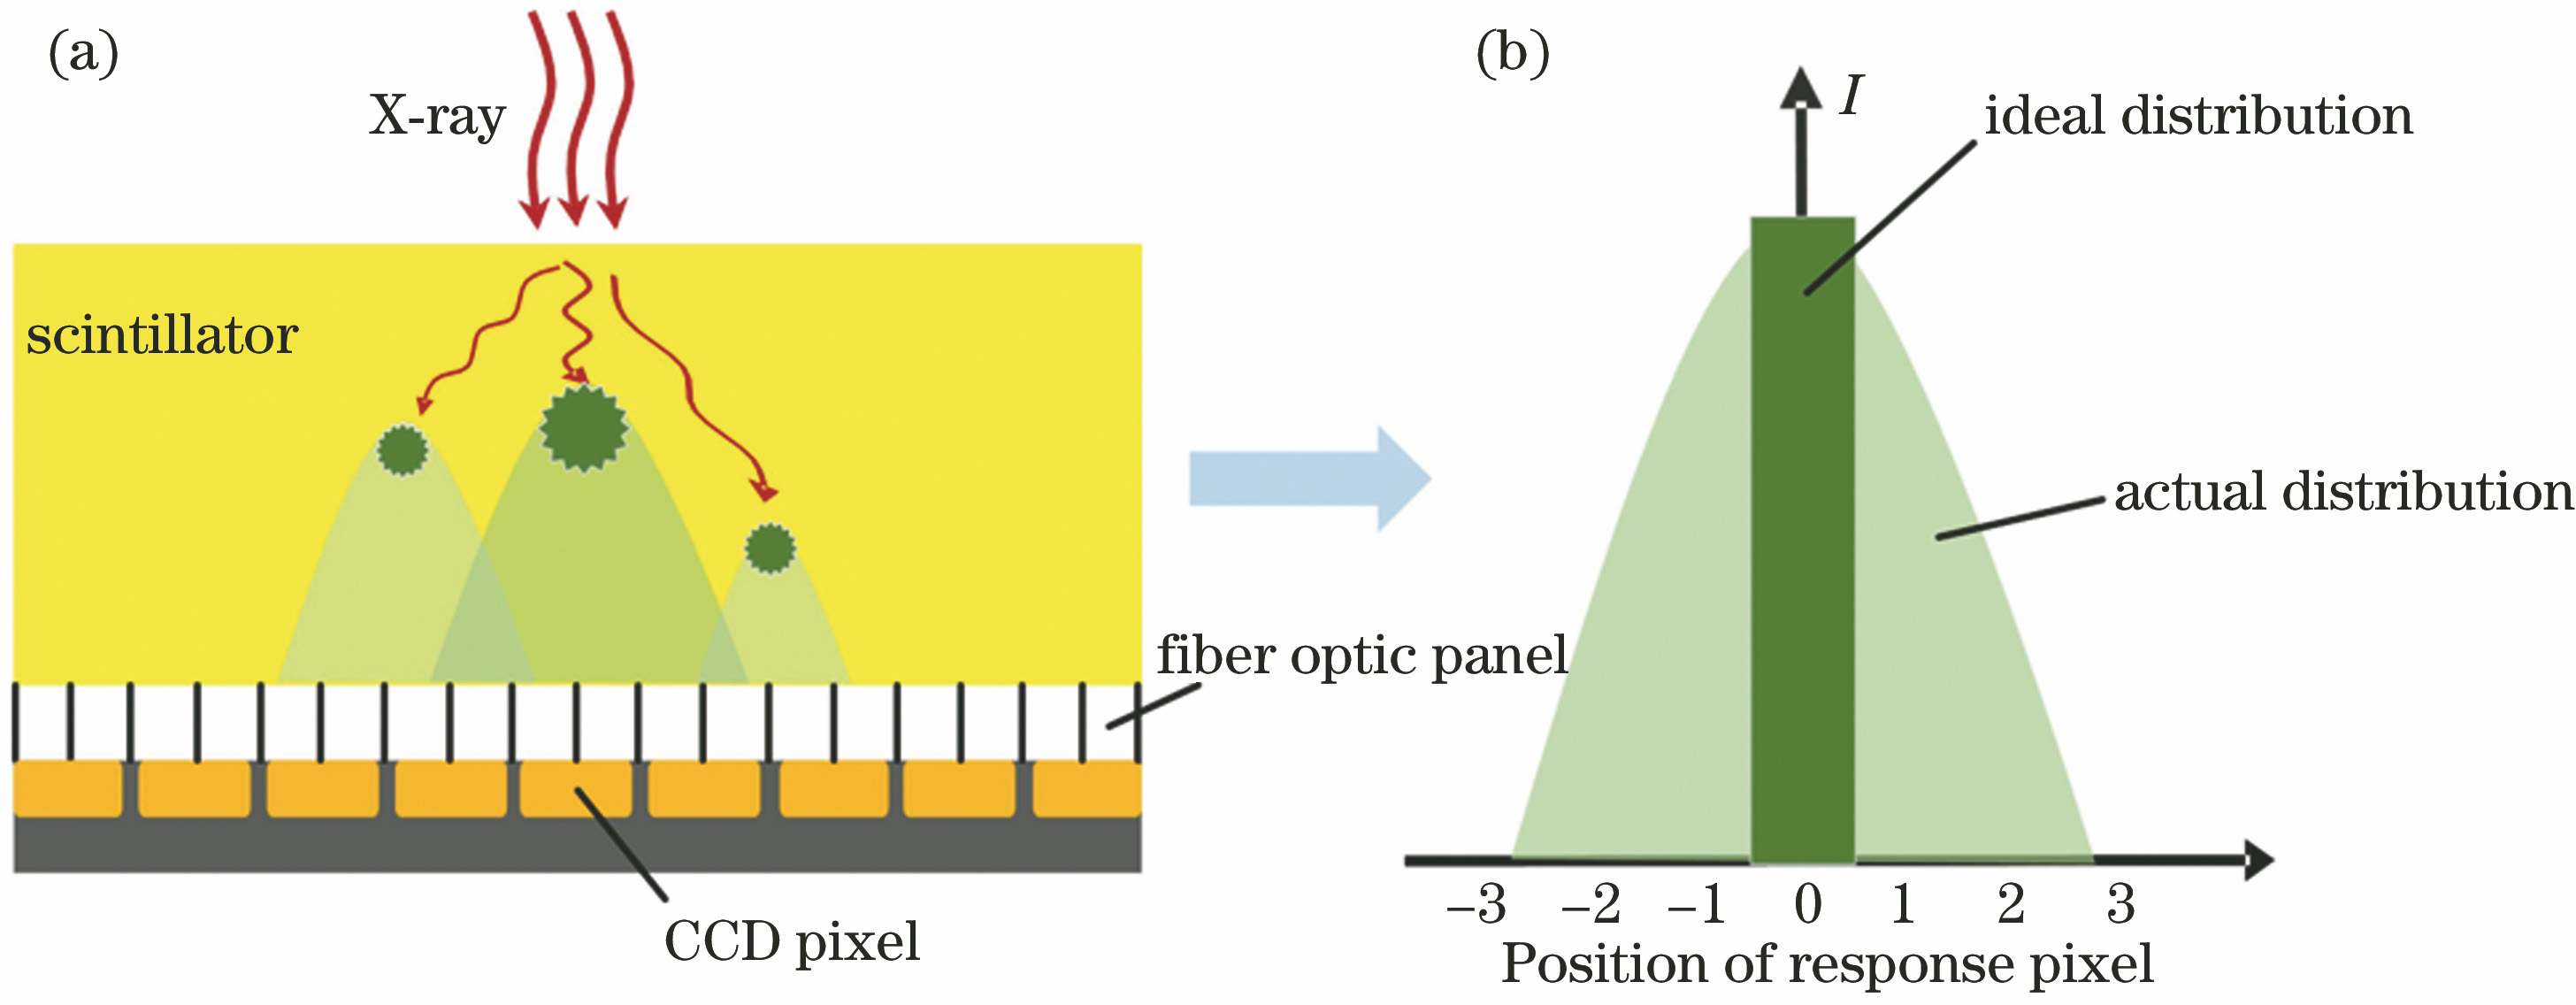
    Fig. 1. Schematic diagram of signal crosstalk in scintillation screen. (a) Schematic diagram of X-ray scattering crosstalk and fluorescence crosstalk; (b) response distribution of CCD pixel to fluorescence
    Simulation model of X-ray scattering
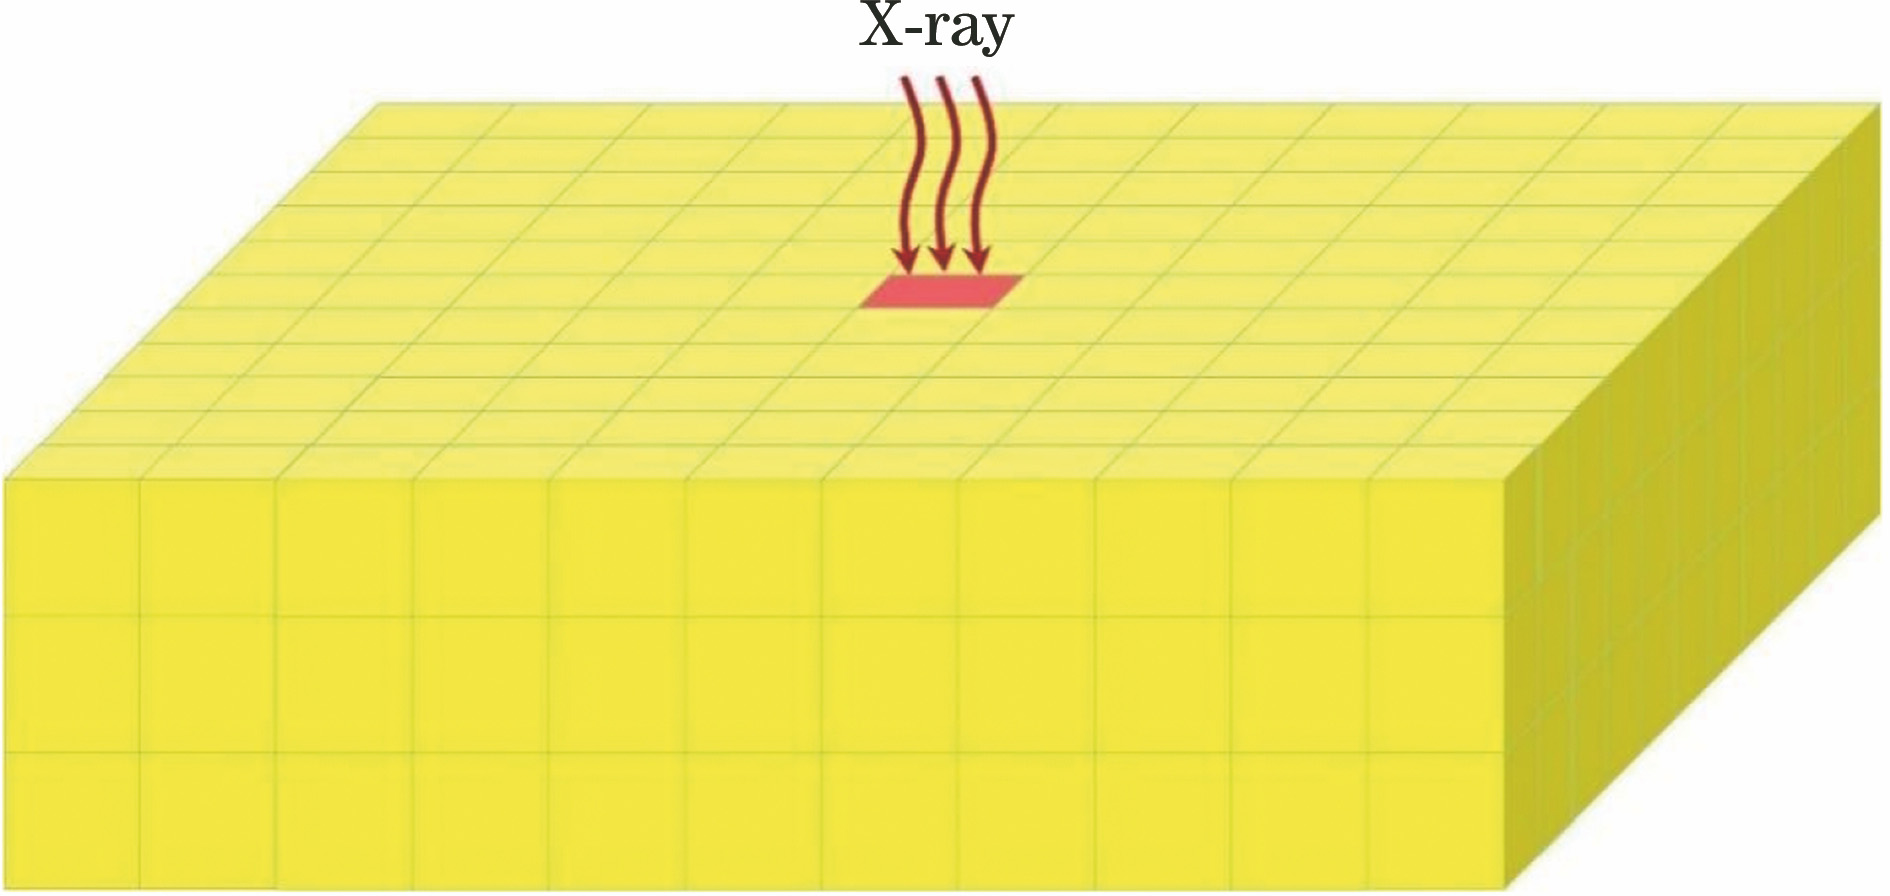
    Fig. 2. Simulation model of X-ray scattering
    Simulation results of X-ray scattering. (a) X-ray absorbed dose distribution in the 1st layer of scintillation screen; (b) ray scattering crosstalk rate curves of central row pixels in the 1st, 25th, and 50th layers of scintillation screen
    Fig. 3. Simulation results of X-ray scattering. (a) X-ray absorbed dose distribution in the 1st layer of scintillation screen; (b) ray scattering crosstalk rate curves of central row pixels in the 1st, 25th, and 50th layers of scintillation screen
    Simulation model of fluorescence crosstalk
    Fig. 4. Simulation model of fluorescence crosstalk
    Simulation results of fluorescence crosstalk. (a) CCD absorption distribution of fluorescence of central voxel in the 1st layer of scintillation screen; (b) fluorescence crosstalk rate curves of central row pixels of the 1st, 25th, and 50th layers in scintillation screen
    Fig. 5. Simulation results of fluorescence crosstalk. (a) CCD absorption distribution of fluorescence of central voxel in the 1st layer of scintillation screen; (b) fluorescence crosstalk rate curves of central row pixels of the 1st, 25th, and 50th layers in scintillation screen
    Effect of numerical aperture of optical fiber panel on spatial resolution of scintillation screen. (a) NA=1.0; (b) NA=0.6; (c) NA=0.2
    Fig. 6. Effect of numerical aperture of optical fiber panel on spatial resolution of scintillation screen. (a) NA=1.0; (b) NA=0.6; (c) NA=0.2
    X-ray radiation imaging test platform
    Fig. 7. X-ray radiation imaging test platform
    Main components of CCD detector. (a) Fiber optic panel with NA=1; (b) KAF-8300 image sensor; (c) GAGG_Ce scintillator; (d) optical panel with NA=0.2
    Fig. 8. Main components of CCD detector. (a) Fiber optic panel with NA=1; (b) KAF-8300 image sensor; (c) GAGG_Ce scintillator; (d) optical panel with NA=0.2
    Physical image of component coupling. (a) Before adding low numerical aperture fiber; (b) after adding low numerical aperture fiber
    Fig. 9. Physical image of component coupling. (a) Before adding low numerical aperture fiber; (b) after adding low numerical aperture fiber
    Physical image of spatial resolution test sample. (a) Double-filament image quality indicator; (b) razor blade
    Fig. 10. Physical image of spatial resolution test sample. (a) Double-filament image quality indicator; (b) razor blade
    Spatial resolution results measured by double-filament image quality indicator method. (a)(b) Before adding low numerical aperture fiber; (c)(d) after adding low numerical aperture fiber
    Fig. 11. Spatial resolution results measured by double-filament image quality indicator method. (a)(b) Before adding low numerical aperture fiber; (c)(d) after adding low numerical aperture fiber
    Spatial resolution results measured by knife-edge method. (a)(b) Before adding low numerical aperture fiber; (c)(d) after adding low numerical aperture fiber
    Fig. 12. Spatial resolution results measured by knife-edge method. (a)(b) Before adding low numerical aperture fiber; (c)(d) after adding low numerical aperture fiber
    ParameterValue
    Type of scintillatorGAGG_Ce(Gd3Al2Ga3O12∶Ge)
    Density of scintillator /(g·cm-3)6.63
    Size of scintillator /(μm×μm×μm)110×110×500
    Number of particles tracked1×107
    Size of single element /(μm×μm×μm)10×10×10
    X-ray energy /keV20~100
    Cross section size of incident ray /(μm×μm)10×10
    Table 1. Main parameters for Monte Carlo simulation
    X-ray energy /keVCrosstalk rate in the 1st layer /%Crosstalk rate in the 25th layer /%Crosstalk rate in the 50th layer /%
    200.691.05
    403.804.134.05
    603.964.924.20
    806.097.126.45
    10010.2111.5910.49
    Table 2. Scattering crosstalk rate of maximal absorbed dose voxel to its adjacent voxels
    ParameterValue
    Size of luminous body /(μm×μm×μm)10×10×10
    Size of scintillator /(μm×μm×μm)2000×2000×500
    Power of luminous body /W1
    Refractive index of GAGG_Ce1.91
    Refractive index of coupling agent1.43
    Thickness of coupling agent /μm3
    Numerical aperture of optical fiber1.43
    Number of particles tracked1×107
    Table 3. Main parameters for fluorescence crosstalk simulation
    Location of luminous bodyCrosstalk rate /%
    1st layer98.67
    25th layer97.04
    50th layer25.92
    Table 4. Crosstalk rate of fluorescence of central voxel to adjacent pixels
    NAEX /keV
    20406080100
    0.20.570.320.380.320.25
    0.65.393.023.623.032.37
    1.012.076.778.106.795.31
    Table 5. X-ray conversion factors under different numerical apertures of optical fiber panels
    NASpatial resolution /(lp·mm-1)
    SimulationExperiment
    1.02517
    0.25062
    Table 6. Comparison of spatial resolution results obtained by simulation and experiment
    Kang An, Wenfang Li, Xiaojiao Duan, Shilin Wu, Rifeng Zhou, Jue Wang. Fiber-Coupled GAGG_Ce X-ray Detector for High-Resolution Imaging[J]. Acta Optica Sinica, 2022, 42(1): 0111001
    Download Citation