
Yuxun Wang, Rui Wang, Wei Yan. Channel Selection for Inversion of Atmospheric Relative Humidity Profile from Ground-Based Hyperspectral Microwave Radiometer[J]. Acta Optica Sinica, 2019, 39(4): 0428002
- Acta Optica Sinica
- Vol. 39, Issue 4, 0428002 (2019)
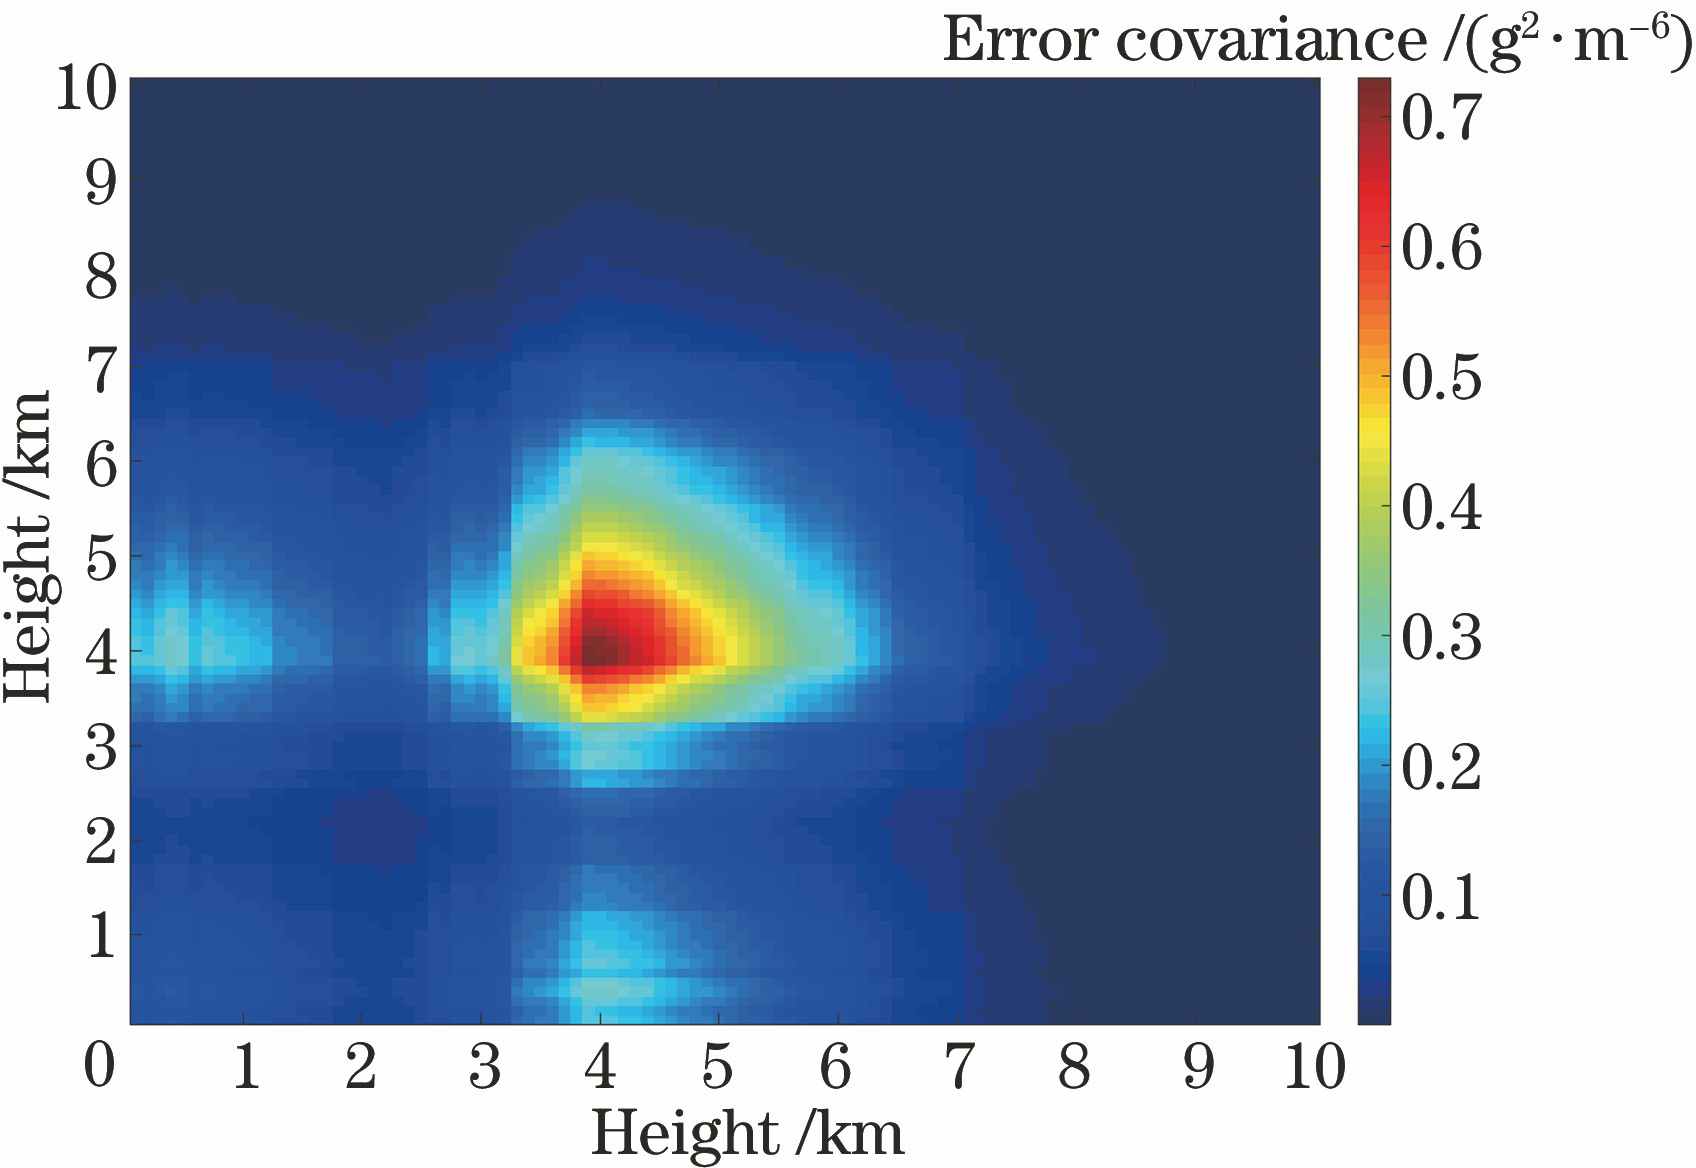
Fig. 1. Background field error covariance matrix
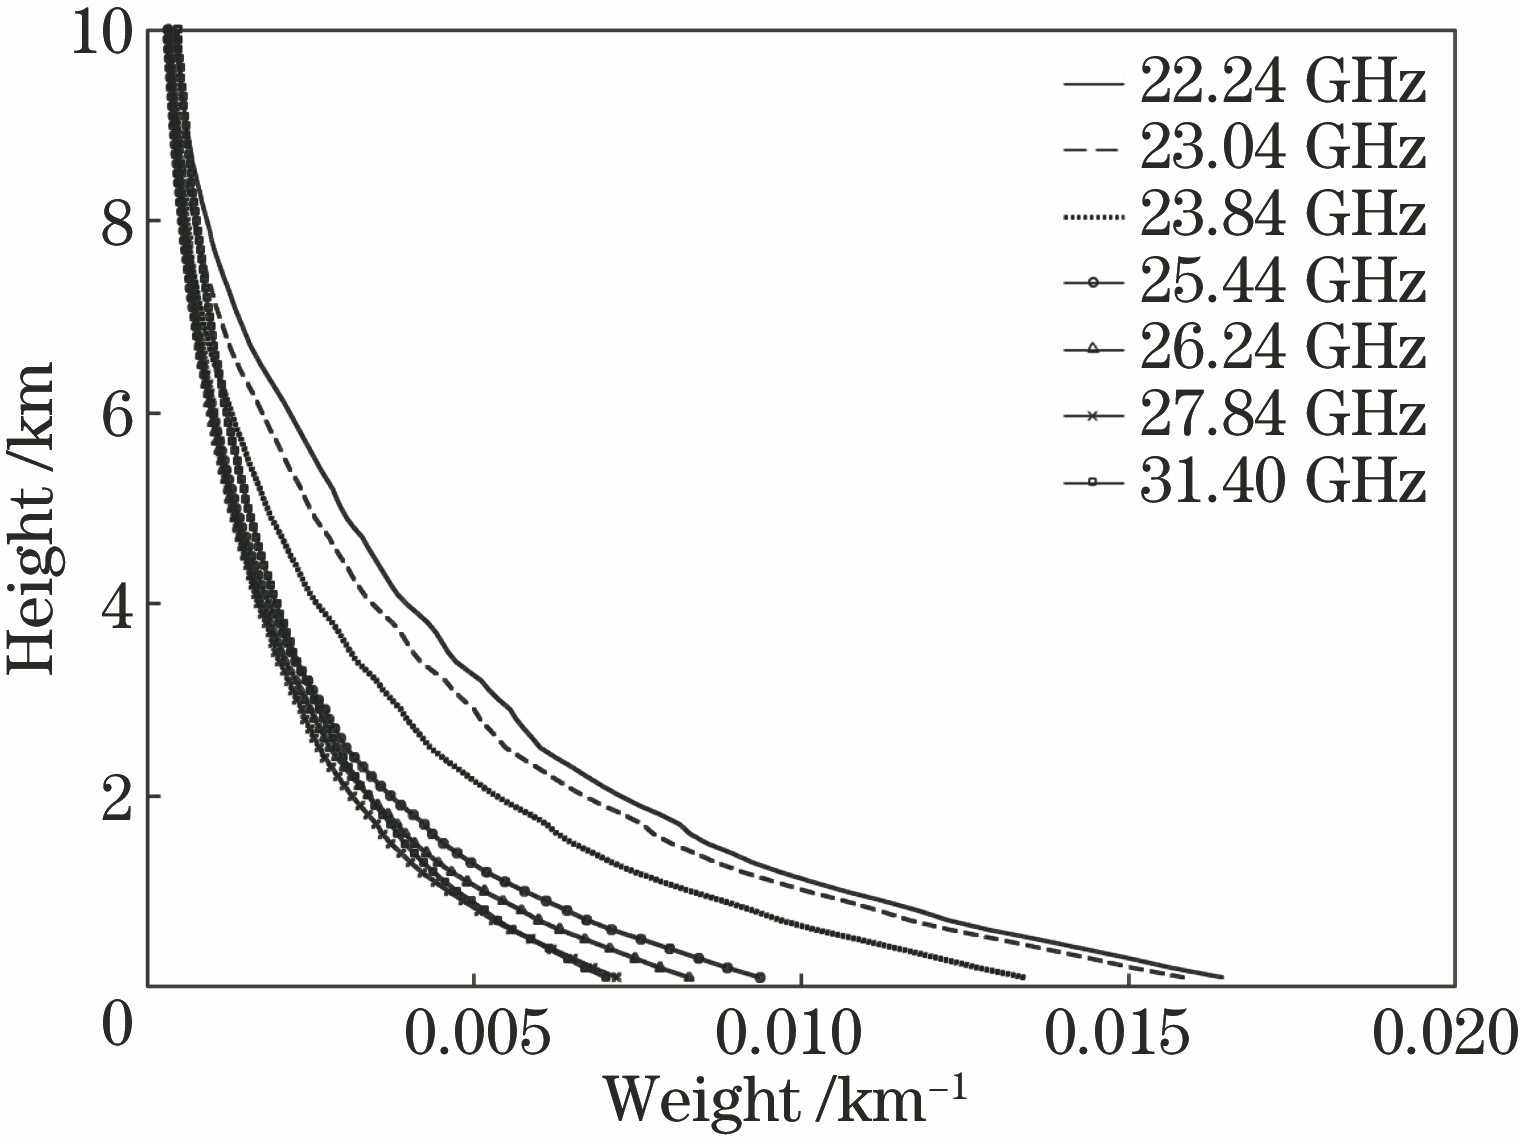
Fig. 2. Jacobian weight function diagram for 7 channels
Fig. 3. Average RBT of oxygen in 200 water vapor channels
Fig. 4. Square of root mean square error of RBT of oxygen in 200 water vapor channels
Fig. 5. Information content distribution of candidate channels
Fig. 6. Accumulated information content
Fig. 7. Information content of 200 channels and 7 channels of RPG-HATRPO-G3
Fig. 8. Information content distributions of 200 channels in condition 1 and condition 2
Fig. 9. Information content distributions of 200 channels in condition 3 and condition 4
Fig. 10. Information content distributions of 200 channels when the square root of the observed error root mean square error is 0.2 K2 and 0.4 K2, respectively
Fig. 11. Flow chart of simulation
Fig. 12. Downward RBT. (a) 200 channels; (b) 7 channels
Fig. 13. Inversion deviation at different heights under different number of channels
Fig. 14. Inversion deviation of different channels

Set citation alerts for the article
Please enter your email address
© Copyright 2018-2021 | Chinese Laser Press. All Rights Reserved 沪ICP备15018463号-20