
Cuili Mao, Rongsheng Lu. A New Method for 3D Shape Reconstruction with a High Dynamic Range Surface[J]. Laser & Optoelectronics Progress, 2023, 60(7): 0712003
- Laser & Optoelectronics Progress
- Vol. 60, Issue 7, 0712003 (2023)
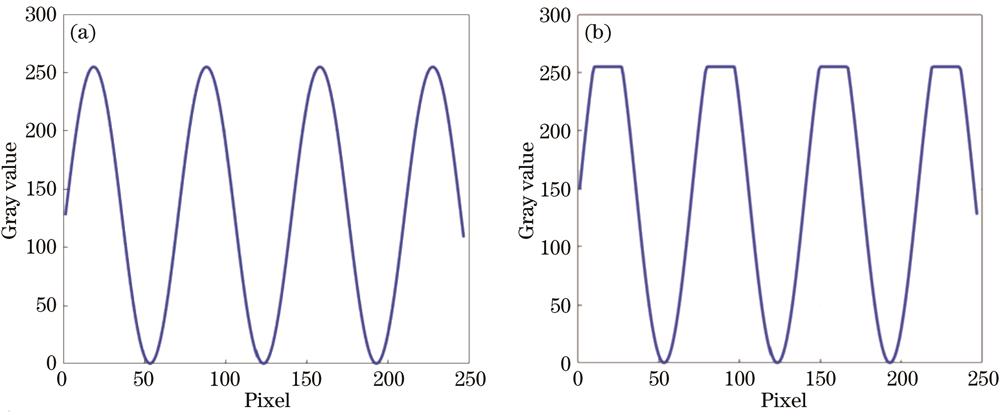
Fig. 1. Captured fringe intensity distribution. (a) Unsaturated fringe pattern; (b) saturated fringe pattern
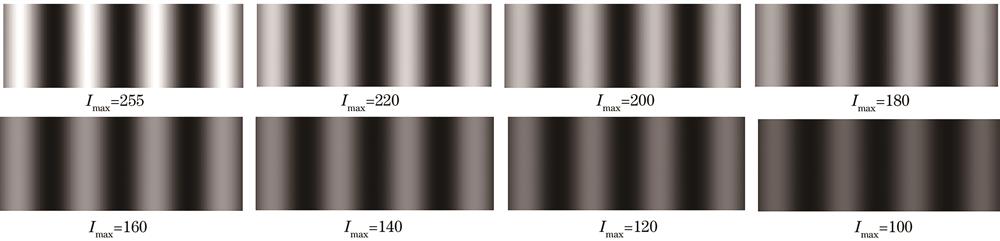
Fig. 2. Grating fringe patterns with different intensity amplitudes
Fig. 3. Gray distribution curves of a line of fringe patterns with different intensity amplitudes
Fig. 4. Unwrapped phase values of a line with different fringes
Fig. 5. Grating fringe patterns with different intensity amplitudes when signal-to-noise ratio is 30 dB
Fig. 6. Unwrapping phase error curves with different intensity amplitudes and signal-to-noise ratios. (a)-(d) Signal-to-noise ratios are 25, 30, 35, and 40 dB, respectively
Fig. 7. Standard deviation curves of phase error with different signal-to-noise ratios and fringe amplitudes
Fig. 8. Experimental system
Fig. 9. Fringe patterns with different amplitudes obtained from experiments
Fig. 10. Unwrapped phases of different fringe amplitudes at f = 4
Fig. 11. Phase error curves of different fringe amplitudes
Fig. 12. Phase error curves excluding intensity amplitude of 255
Fig. 13. Standard deviation curve of phase error with different projection fringe amplitudes
Fig. 14. Measured object with high dynamic range
Fig. 15. Captured fringe patterns with different intensity amplitudes of projected fringe. (a) Imax=200; (b) Imax=250
Fig. 16. 3D point cloud of measured object surface. (a) When projecting low amplitude fringes; (b) when projecting high amplitude fringes; (c) fused measurements
| |||||||||||||||||||||||||||||||||||||||||||||||||||||
Table 1. Standard deviation of phase error under different projection fringe amplitudes and signal-to-noise ratios
|
Table 2. Standard deviation of phase errors under different fringe intensity amplitudes
|
Table 3. Best fringe intensity amplitude with different r

Set citation alerts for the article
Please enter your email address
© Copyright 2018-2021 | Chinese Laser Press. All Rights Reserved 沪ICP备15018463号-20