• Acta Optica Sinica
  • Vol. 41, Issue 9, 0930001 (2021)
Chunlai Sui1, Yong Tan1、*, Ye Zhang1, Lu Chen1, Maolin Feng1, and Fengyi Liu2
Author Affiliations
  • 1School of Science, Changchun University of Science and Technology, Changchun, Jilin 130022, China
  • 2Jilin Judicial Appraisal Center, Jilin, Jilin 132011, China
  • show less
    DOI: 10.3788/AOS202141.0930001 Cite this Article Set citation alerts
    Chunlai Sui, Yong Tan, Ye Zhang, Lu Chen, Maolin Feng, Fengyi Liu. Fiber Evidence Identification Based on Spectral Bidirectional Reflectance Distribution Function[J]. Acta Optica Sinica, 2021, 41(9): 0930001 Copy Citation Text show less
    Schematic of target scattering spectrum measurement
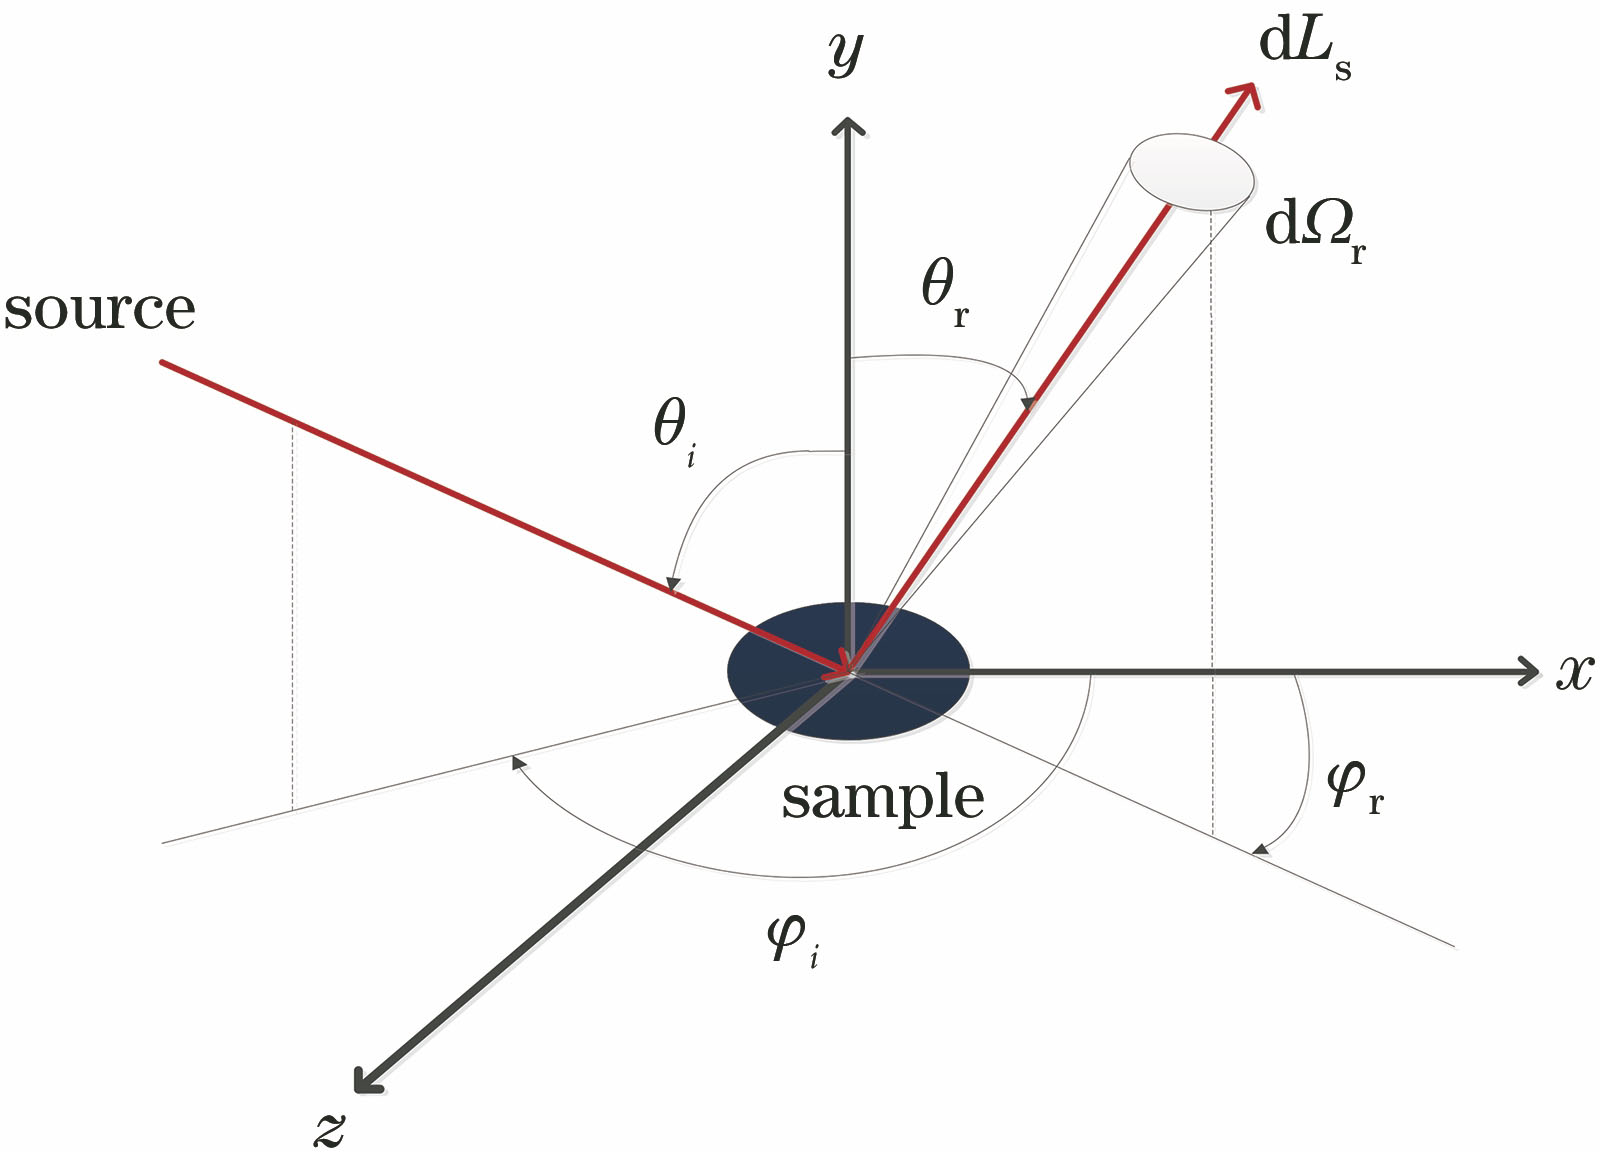
    Fig. 1. Schematic of target scattering spectrum measurement
    Experimental device diagram
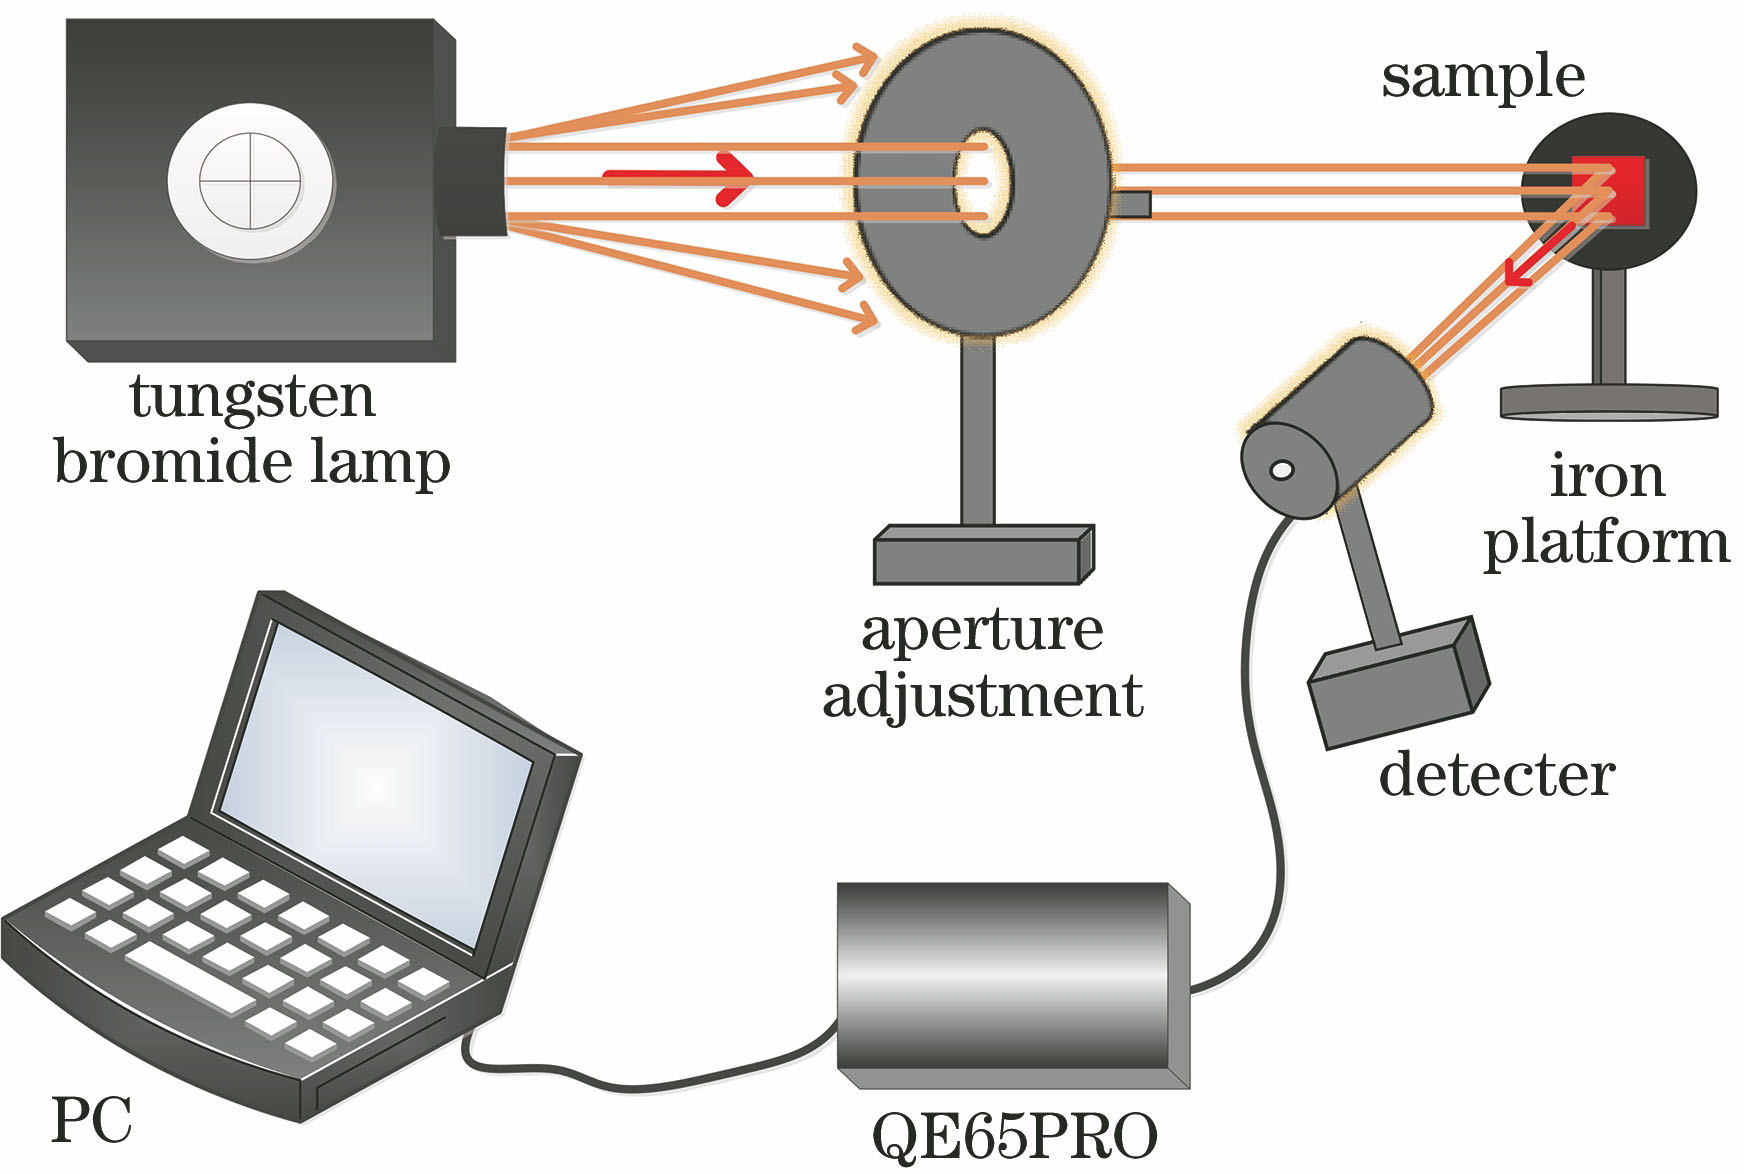
    Fig. 2. Experimental device diagram
    Spectral lines of BRDF value of ice wire sample in purple sample group calculated when the incident angle is 45° and the observation angle is 30°, 45°, and 60° as function of wavelength. (a) Spectral lines; (b) normalized spectral lines
    Fig. 3. Spectral lines of BRDF value of ice wire sample in purple sample group calculated when the incident angle is 45° and the observation angle is 30°, 45°, and 60° as function of wavelength. (a) Spectral lines; (b) normalized spectral lines
    Spectral lines of each sample in purple sample group calculated when the incident angle is 45° and observation angle is 60°. (a) Spectral line of BRDF value changing with wavelength; (b) spectral line of the difference value between X-fiber and each sample in purple sample group as a function of wavelength; (c) spectral line of the first-order differential of BRDF value varying with the wavelength; (d) spectral line of the first-order differential difference of BRDF value between X-fiber and each sample in purple sample group as a function of wavelength
    Fig. 4. Spectral lines of each sample in purple sample group calculated when the incident angle is 45° and observation angle is 60°. (a) Spectral line of BRDF value changing with wavelength; (b) spectral line of the difference value between X-fiber and each sample in purple sample group as a function of wavelength; (c) spectral line of the first-order differential of BRDF value varying with the wavelength; (d) spectral line of the first-order differential difference of BRDF value between X-fiber and each sample in purple sample group as a function of wavelength
    Spectral lines of each sample in purple sample group calculated when the incident angle is 45° and observation angle is 45°. (a) Spectral line of BRDF value changing with wavelength; (b) spectral line of the difference value between X-fiber and each sample in purple sample group as a function of wavelength; (c) spectral line of the first-order differential of BRDF value varying with the wavelength; (d) spectral line of the first-order differential difference of BRDF value between X-fiber and each sample in purple sample group as a function of wavelength
    Fig. 5. Spectral lines of each sample in purple sample group calculated when the incident angle is 45° and observation angle is 45°. (a) Spectral line of BRDF value changing with wavelength; (b) spectral line of the difference value between X-fiber and each sample in purple sample group as a function of wavelength; (c) spectral line of the first-order differential of BRDF value varying with the wavelength; (d) spectral line of the first-order differential difference of BRDF value between X-fiber and each sample in purple sample group as a function of wavelength
    Spectral lines of each sample in purple sample group calculated when the incident angle is 45° and observation angle is 30°. (a) Spectral line of BRDF value changing with wavelength; (b) spectral line of the difference value between X-fiber and each sample in purple sample group as a function of wavelength; (c) spectral line of the first-order differential of BRDF value varying with the wavelength; (d) spectral line of the first-order differential difference of BRDF value between X-fiber and each sample in purple sample group as a function of wavelength
    Fig. 6. Spectral lines of each sample in purple sample group calculated when the incident angle is 45° and observation angle is 30°. (a) Spectral line of BRDF value changing with wavelength; (b) spectral line of the difference value between X-fiber and each sample in purple sample group as a function of wavelength; (c) spectral line of the first-order differential of BRDF value varying with the wavelength; (d) spectral line of the first-order differential difference of BRDF value between X-fiber and each sample in purple sample group as a function of wavelength
    BRDF value and least square fitting curve of each sample in gray sample group calculated when incidence angle is 45° and observation angle is 30°
    Fig. 7. BRDF value and least square fitting curve of each sample in gray sample group calculated when incidence angle is 45° and observation angle is 30°
    Simulation results of three samples in red sample group by Davis model.(a) Silk sample; (b) cotton sample; (c) woolen sample 1
    Fig. 8. Simulation results of three samples in red sample group by Davis model.(a) Silk sample; (b) cotton sample; (c) woolen sample 1
    Simulation results of three samples in red sample group in wavelength of 500-950 nm by Davis model. (a) Silk sample; (b) cotton sample; (c) woolen sample 1
    Fig. 9. Simulation results of three samples in red sample group in wavelength of 500-950 nm by Davis model. (a) Silk sample; (b) cotton sample; (c) woolen sample 1
    Sample colorSample materialObservation angle /(°)
    PurpleIce silk, rich yarn, sweat cloth, chemical fiber, random hemp, organza30,45,60
    GreySatin, synthetic fiber, hemp, woolen cloth, cotton, cotton and linen30,45,60
    RedCotton, wool 1, wool 2, satin, silk, polyester30,45,60
    Table 1. Classification table of fiber samples
    Sample typeFitting curve functionSum of squares of residualsR2
    SatinFr=53.41-0.28λ+4.85λ2-2.82λ30.018750.40620
    Synthetic fiberFr=-457.84+3.34λ-0.010λ2+1.09λ3-4.92λ40.026640.30828
    HempFr=1.29-0.0025λ+1.265λ2+1.48λ30.009090.43141
    Woolen clothFr=0.0059+0.00175λ-4.574λ2+3.638λ30.003110.89216
    CottonFr=119.095-0.83λ+0.00218λ2-2.53λ30.004730.70283
    Cotton and linenFr=12.274-0.087λ+2.364λ2-2.865λ3+1.304λ40.003940.78362
    Y-fiberFr=1.26789-0.0044λ+5.49λ2-1.8833λ30.003140.88796
    Table 2. Least square fitting parameters of BRDF value of each sample in gray sample group calculated when incident angle is 45°and observation angle is 30°
    Sample(red)Surfaceroughness /μmAutocorrelationlength /μm
    Silk0.27.2061
    Cotton0.45.1638
    Woolen cloth 10.85.0435
    Table 3. Relationship between surface roughness of each sample in red sample group and autocorrelation length
    Chunlai Sui, Yong Tan, Ye Zhang, Lu Chen, Maolin Feng, Fengyi Liu. Fiber Evidence Identification Based on Spectral Bidirectional Reflectance Distribution Function[J]. Acta Optica Sinica, 2021, 41(9): 0930001
    Download Citation