• Spectroscopy and Spectral Analysis
  • Vol. 41, Issue 11, 3352 (2021)
Hong-mei LIN1、*, Qiu-hong CAO1、1;, Tong-jun ZHANG1、1;, Zhao-xin LI1、1;, Hai-qing HUANG1、1;, Xue-min LI1、1;, Bin WU2、2;, Qing-jian ZHANG3、3;, Xin-min LÜ4、4;, and De-hua LI1、1; *;
Author Affiliations
  • 11. Qingdao Key Laboratory of Terahertz Technology, College of Electronic and Information Engineering, Shandong University of Science and Technology, Qingdao 266590, China
  • 22. The 41st Research Institute of CETC, Qingdao 266555, China
  • 33. Technology Center of Qingdao Customs, Qingdao 266002, China
  • 44. Technology Center of Alashankou Customs, Alashankou 833400, China
  • show less
    DOI: 10.3964/j.issn.1000-0593(2021)11-3352-05 Cite this Article
    Hong-mei LIN, Qiu-hong CAO, Tong-jun ZHANG, Zhao-xin LI, Hai-qing HUANG, Xue-min LI, Bin WU, Qing-jian ZHANG, Xin-min LÜ, De-hua LI. Identification of Nephrite and Imitations Based on Terahertz Time-Domain Spectroscopy and Pattern Recognition[J]. Spectroscopy and Spectral Analysis, 2021, 41(11): 3352 Copy Citation Text show less
    Experimental schematic diagram of THz-TDS
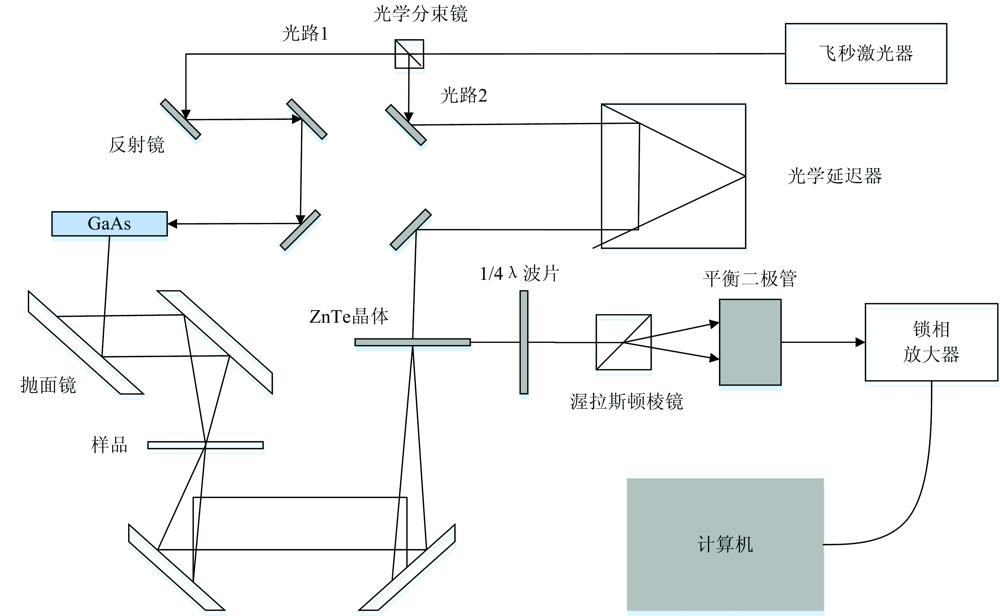
    Fig. 1. Experimental schematic diagram of THz-TDS
    (a) Terahertz frequency spectrum, (b) refractive index of glass, marble, raw gemstone and Jades from Afghanistan, China’s Qinghai, Pakistan and China’s Xinjiang
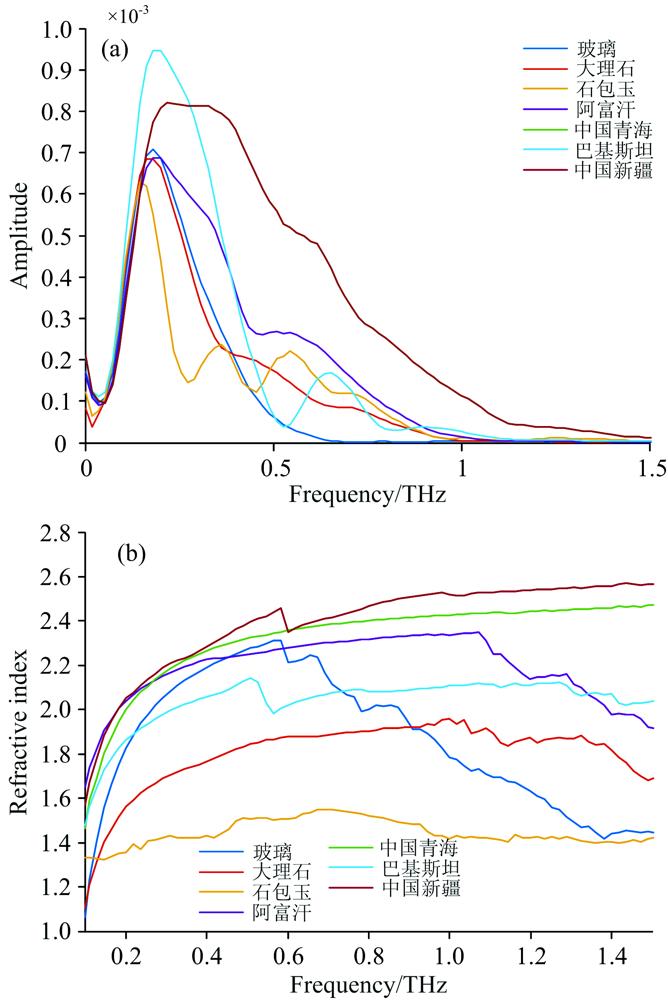
    Fig. 2. (a) Terahertz frequency spectrum, (b) refractive index of glass, marble, raw gemstone and Jades from Afghanistan, China’s Qinghai, Pakistan and China’s Xinjiang
    Scores of the first and second principal components of jade samples from Afghanistan, China’s Qinghai, Pakistan and China’s Xinjiang and imitations
    Fig. 3. Scores of the first and second principal components of jade samples from Afghanistan, China’s Qinghai, Pakistan and China’s Xinjiang and imitations
    Result of GridSearch-SVM parameter selection(optimal parameter c=2.828 4, g=2)
    Fig. 4. Result of GridSearch-SVM parameter selection(optimal parameter c=2.828 4, g=2)
    Fitness curve of GA(optimal parameter c=1.740 1, g=4.544 6)
    Fig. 5. Fitness curve of GA(optimal parameter c=1.740 1, g=4.544 6)
    Fitness curve of PSO(optimal parameter c=11.287 2, g=1.833 1)
    Fig. 6. Fitness curve of PSO(optimal parameter c=11.287 2, g=1.833 1)
    成分方差贡献率/%累计方差贡献率/%
    PC166.19266.192
    PC226.86193.053
    PC33.84496.897
    PC41.51198.408
    Table 1. Variance contribution index and cumulative variance contribution index of each principal component of refractive index
    优化方法最优
    参数
    c
    最优
    参数
    g
    种群
    数量
    迭代
    次数
    建模
    耗时
    /s
    测试集
    准确率
    /%
    网格搜索法2.828 42202001.3997.7
    遗传算法1.740 14.544 6202003.6098.3
    粒子群算法11.287 21.833 1202006.1398.6
    Table 2. Comparison of three optimization methods of SVM combined with Gridsearch, GA and PSO
    Hong-mei LIN, Qiu-hong CAO, Tong-jun ZHANG, Zhao-xin LI, Hai-qing HUANG, Xue-min LI, Bin WU, Qing-jian ZHANG, Xin-min LÜ, De-hua LI. Identification of Nephrite and Imitations Based on Terahertz Time-Domain Spectroscopy and Pattern Recognition[J]. Spectroscopy and Spectral Analysis, 2021, 41(11): 3352
    Download Citation