
Fuzhen Yang, Xinhua Chen, Zhicheng Zhao, Quan Liu, Weimin Shen. Visible-Infrared Imaging Spectrometer for the Exploration of Asteroids[J]. Acta Optica Sinica, 2020, 40(7): 0722002
- Acta Optica Sinica
- Vol. 40, Issue 7, 0722002 (2020)
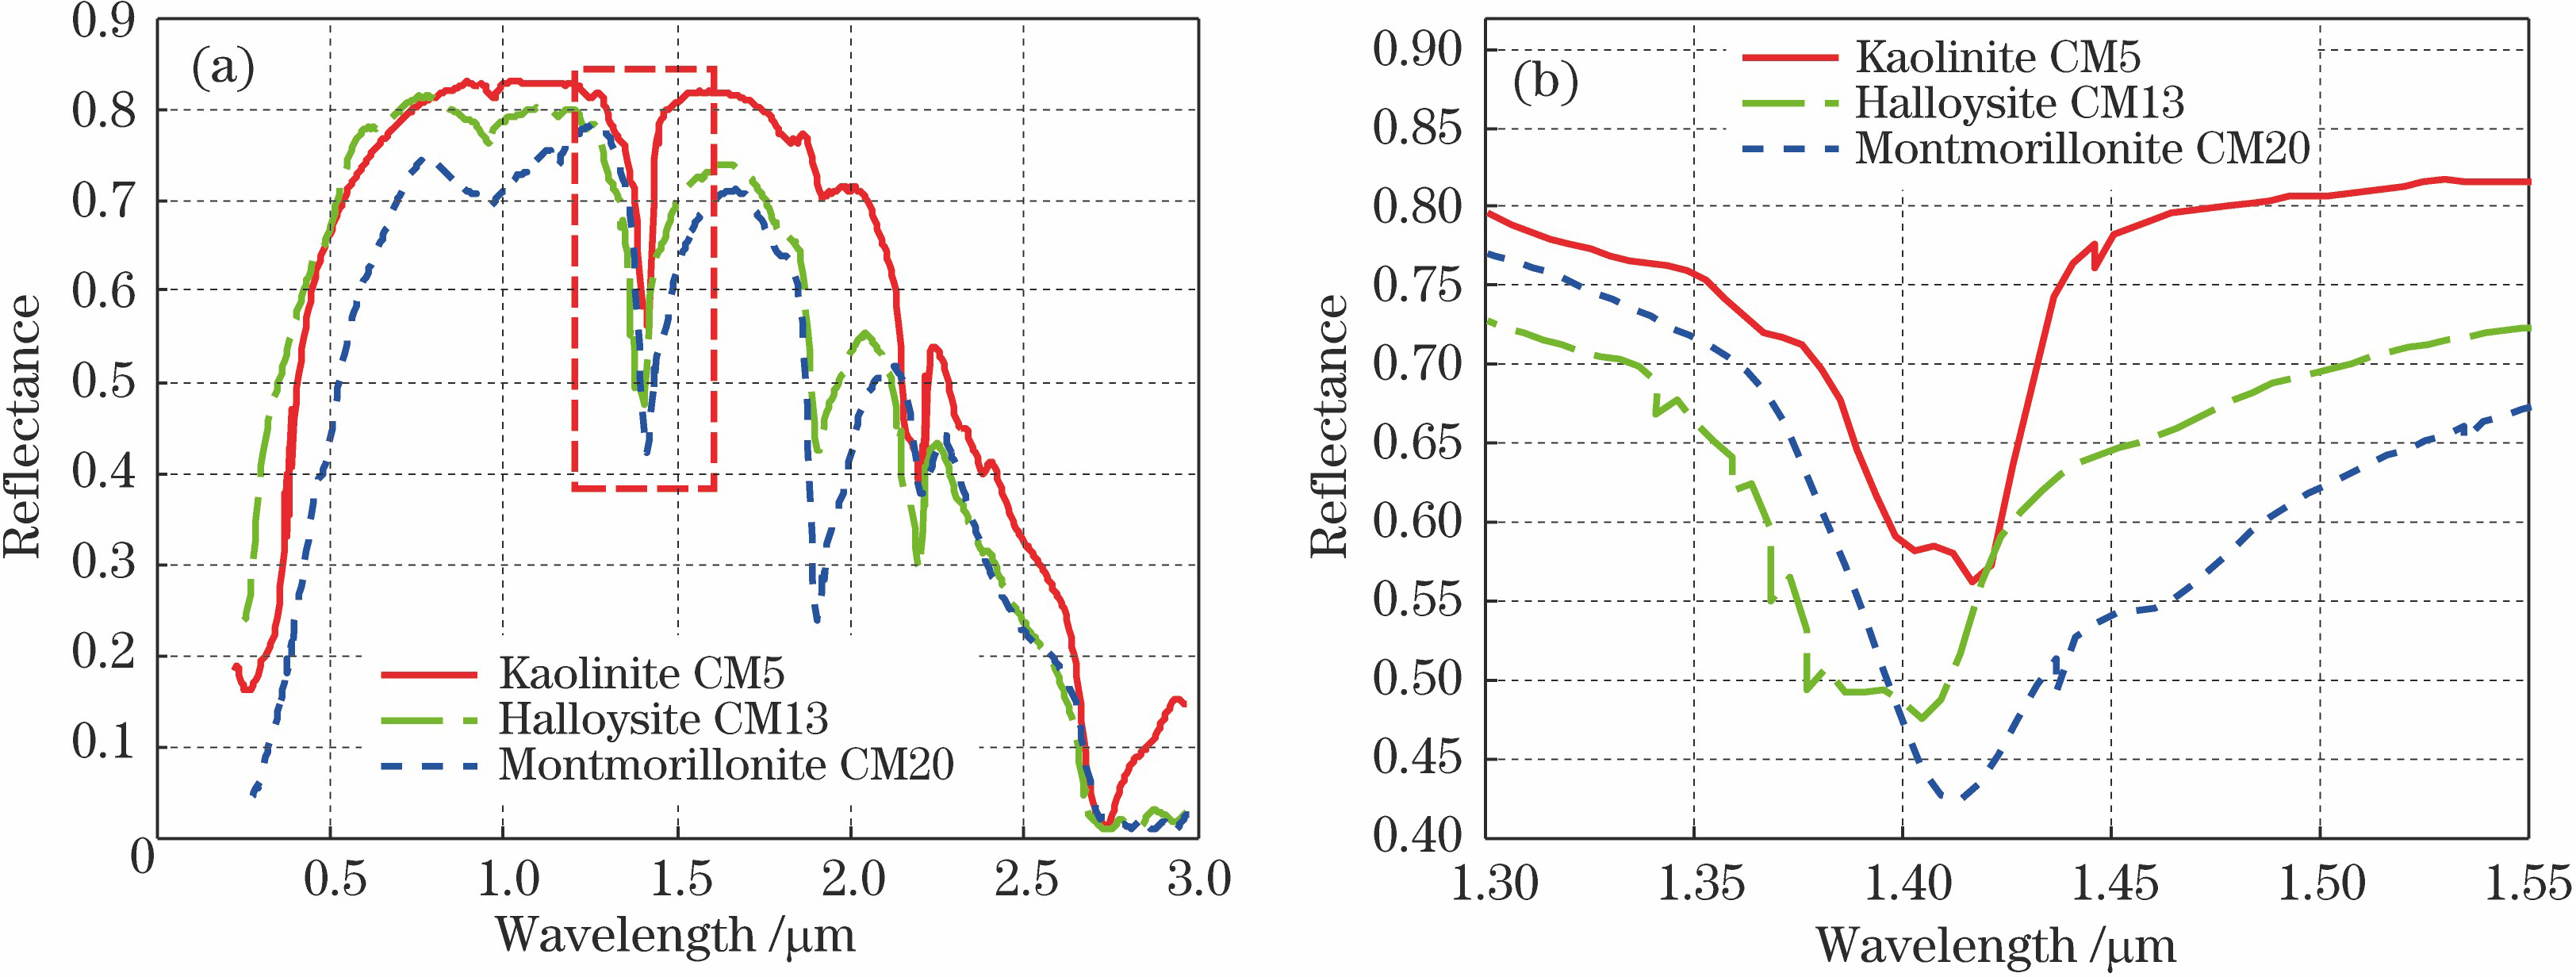
Fig. 1. VNIR-SWIR reflection spectra of Kaolinite, Halloysite and Montmorillonite. (a) Typical spectral curve; (b) local enlarged drawing of the selected area in Fig. 1 (a)
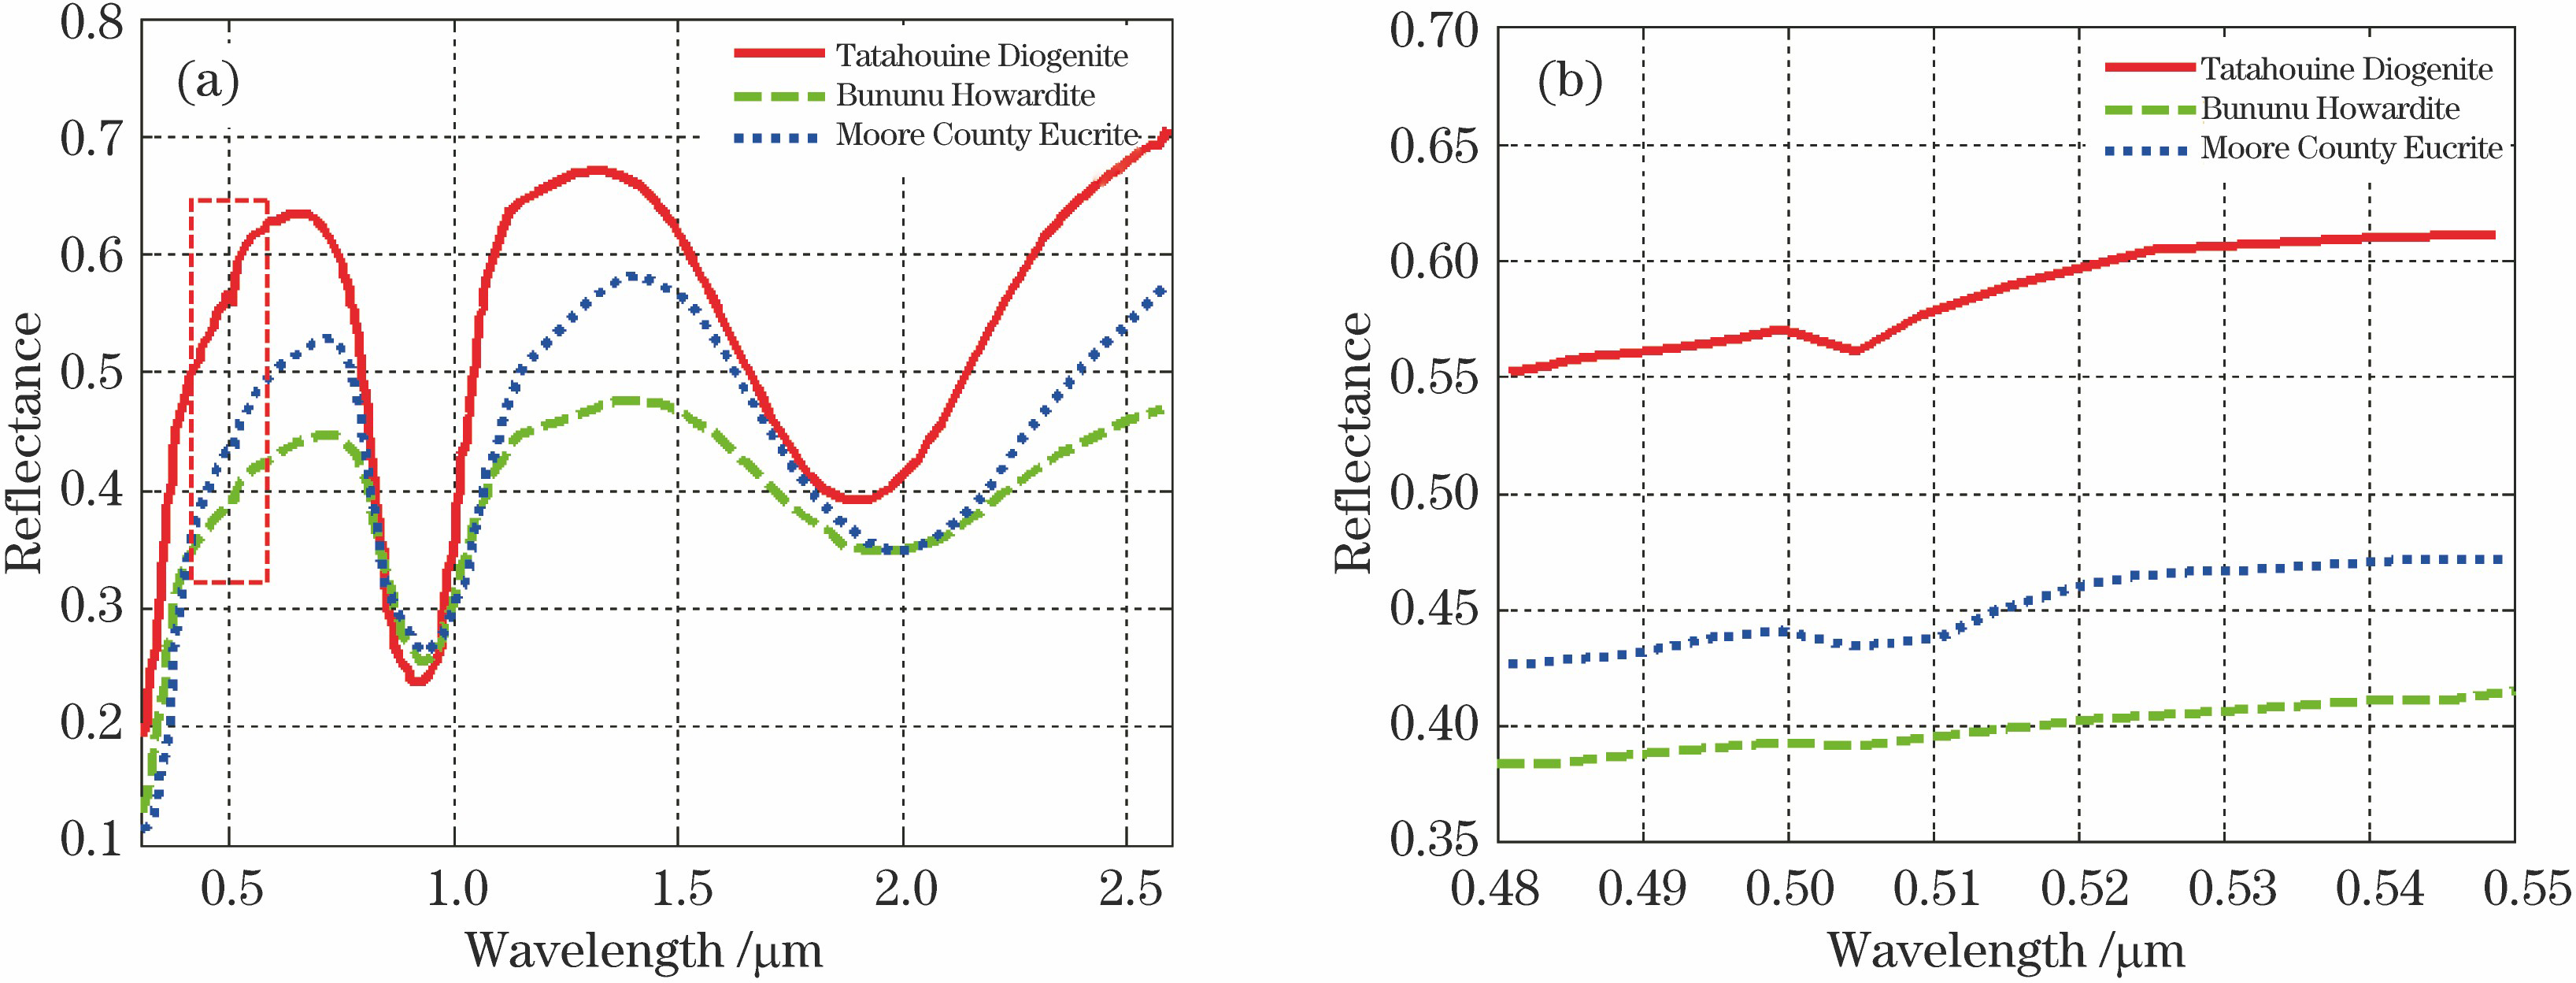
Fig. 2. VNIR-SWIR reflection spectra of HEDs. (a) Spectral curve of HEDs from different regions; (b) local enlarged drawing of the selected area in Fig. 2 (a)
Fig. 3. Diagram of the partitioned diffraction gratings
Fig. 4. Imaging diagram of Rowland circles on meridional image locations
Fig. 5. Steps to calculate the initial structure
Fig. 6. Optical layout of the designed optical system
Fig. 7. Spot diagram of designed optical system
Fig. 8. Curve of the smile versus the normalized field of view
Fig. 9. Curve of the keystone versus the normalized field of view
Fig. 10. Diffraction efficiency of gratings in VNIR band. (a) Diffraction efficiency at different blaze angles; (b) combined diffraction efficiency with different area ratios
Fig. 11. Diffraction efficiency of gratings in SWIR band
Fig. 12. Partitioned grating and the prototype of the designed optical system. (a) Partitioned grating; (b) prototype of the designed optical system
Fig. 13. Photo of the spectrum performance measurement device for the VNIR band
Fig. 14. Spectral image and intensity distribution curves in the VNIR band
Fig. 15. Photo of the spectrum performance measurement device for the SWIR band
Fig. 16. Spectral image and intensity distribution curves at 1900 nm
| |||||||||||||||||||||
Table 1. Main parameters of the system
| ||||||||||||||||||||||||||||||||||||||||
Table 2. Initial structural parameters of the system
| ||||||||||||||||||||||||||||||||||||||||||||||||
Table 3. MTF at the Nyquist frequency (20 lp/mm)
| ||||||||||||||||||||||||
Table 4. Measurement results of the spectral resolution, smile and keystone in VNIR band
| ||||||||||||||||||||||||
Table 5. Measurement results of the spectral resolution, smile and keystone in SWIR band

Set citation alerts for the article
Please enter your email address
© Copyright 2018-2021 | Chinese Laser Press. All Rights Reserved 沪ICP备15018463号-20